
Learn Smart Money Concepts
for Forex, Gold & Crypto
Learn how institutional traders analyze the market using Smart Money Concepts.
Explore key Smart Money Concepts including Market Structure, Liquidity, Break of Structure (BOS), Change of Character (CHoCH), Order Blocks, Fair Value Gaps (FVG), and Premium & Discount Zones.
Build a structured trading process for Forex, Gold, and Cryptocurrency traders.
SMART MONEY CONCEPTS
Institutional Trading Workflow
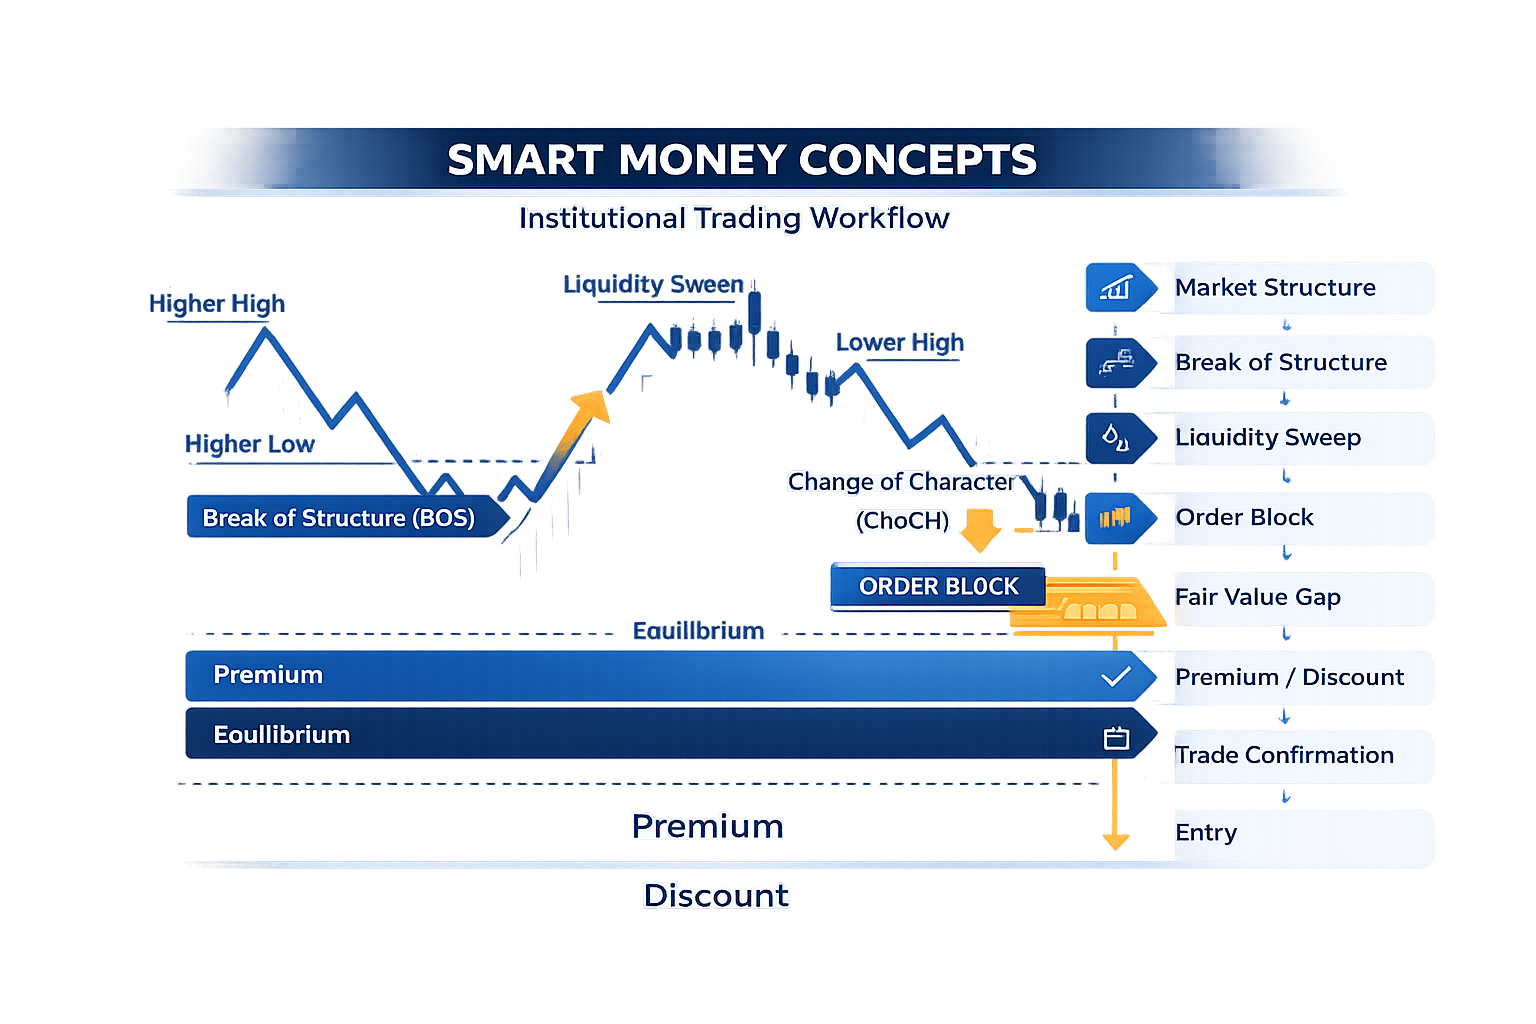
What is Smart Money Concepts (SMC)?
Smart Money Concepts (SMC) is a professional trading methodology that focuses on understanding how institutional traders, banks, and large financial institutions interact with the market.
Instead of relying only on traditional indicators, SMC emphasizes market structure, liquidity, and price action to identify high-probability trading opportunities.
Why Learn Smart Money Concepts?
SMC helps traders understand the logic behind price movements rather than simply reacting to them.
By learning how institutional participants create liquidity and move the market, traders can make more informed decisions and develop a structured trading approach.
What You Will Learn

Market Structure
Understand trends, higher highs, lower lows, and the overall market direction.

Liquidity
Learn how liquidity zones influence price movements and why they matter.

Order Blocks & Fair Value Gaps
Identify institutional price zones and market imbalances that traders commonly analyze.

Risk Management
Build disciplined trading habits with proper risk management and trade planning.
Your Smart Money Concepts Learning Roadmap
Smart Money Concepts is best learned in a structured order.
Each concept builds on the previous one, helping you understand how institutional traders analyze the market and execute high-probability trades.
Follow this roadmap to build a strong trading foundation step by step.
Step 1
Market Structure
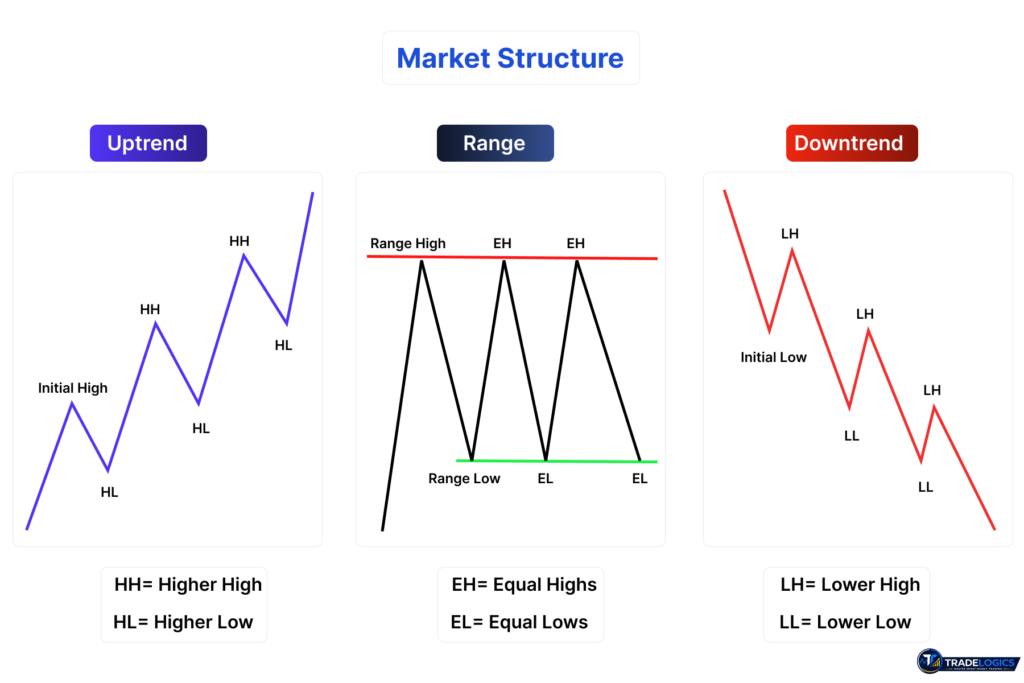
Learn how to identify trends, market direction, Higher Highs (HH), Higher Lows (HL), Lower Highs (LH), and Lower Lows (LL).
Market Structure is the foundation of every Smart Money trading strategy.
Step 2
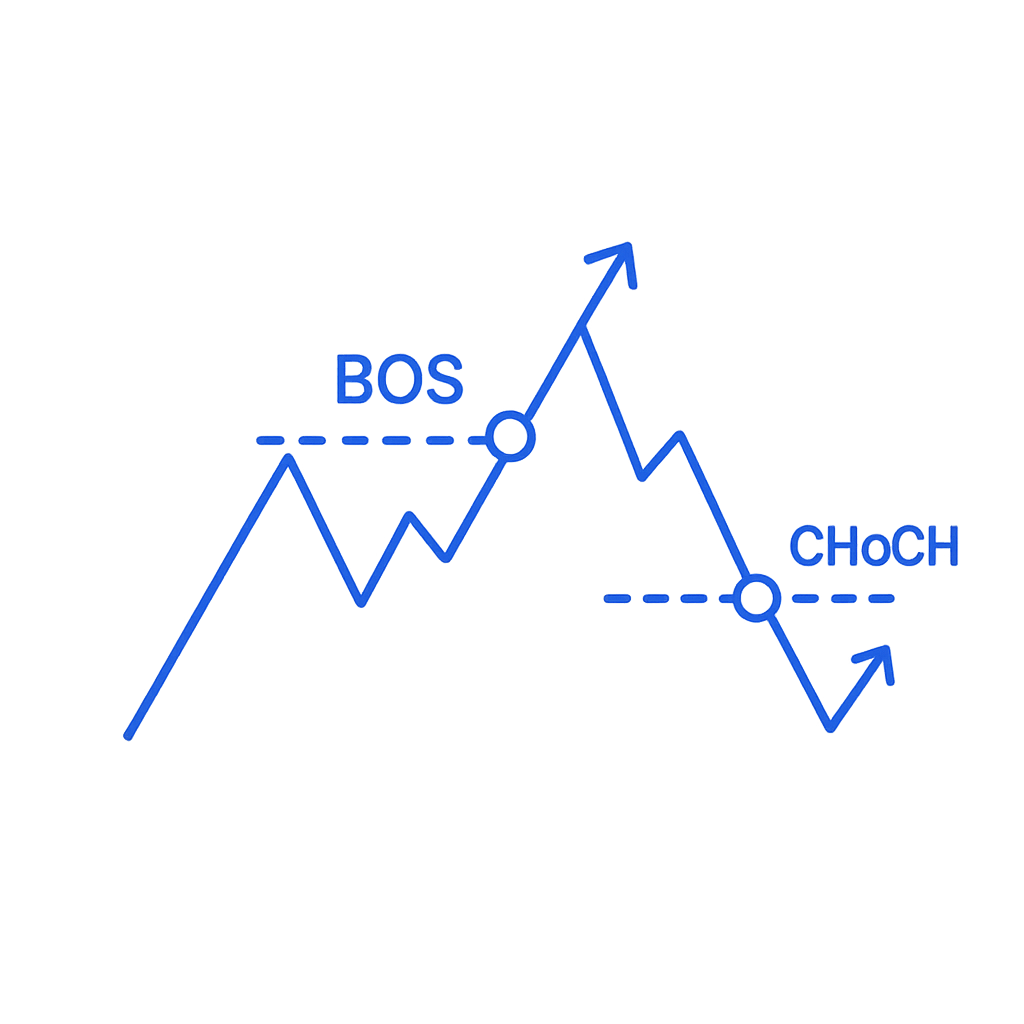
(BOS) & (CHoCH)
Understand how market trends confirm or reverse using BOS and CHoCH.
These concepts help traders recognize potential continuation and reversal opportunities
Step 3
Liquidity
Discover how liquidity influences price movement.
Learn about Buy-Side Liquidity, Sell-Side Liquidity, Liquidity Sweeps, and why institutions target these areas.
Step 4
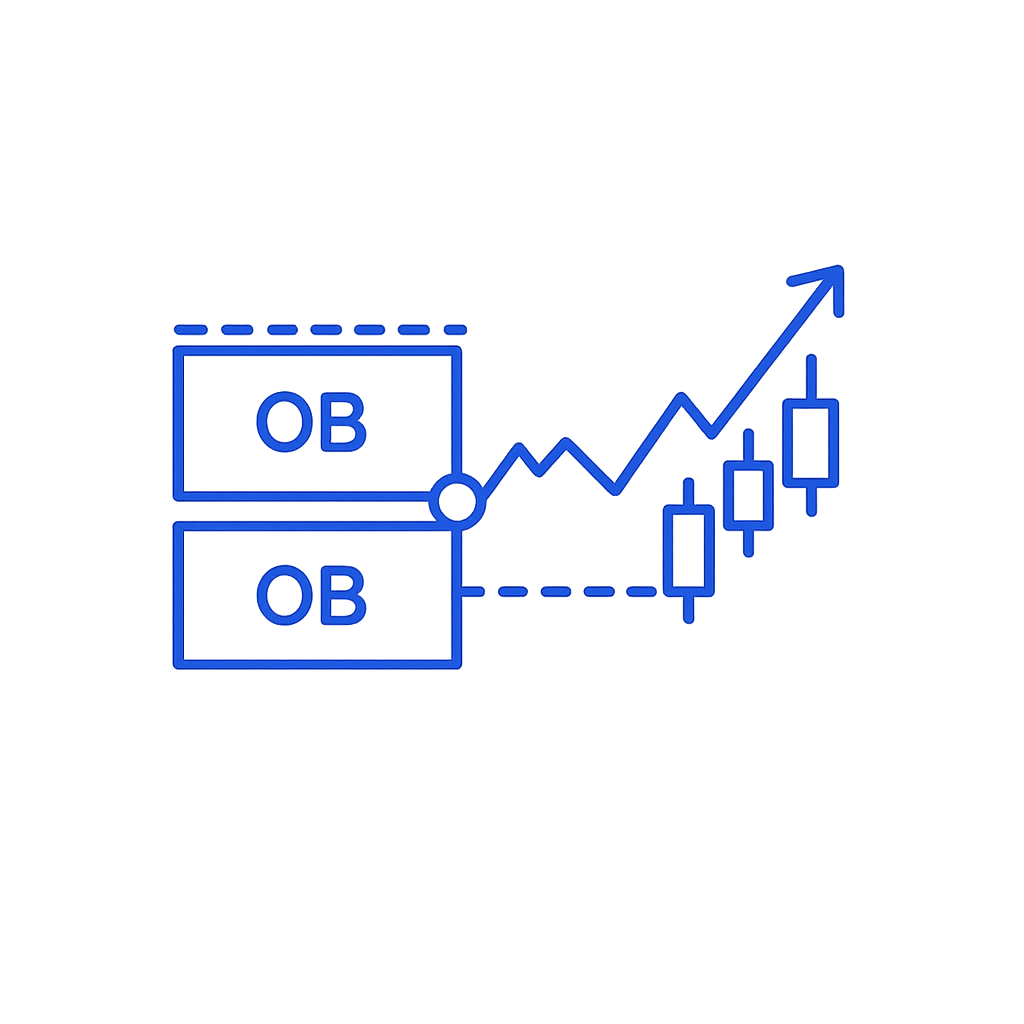
Order Blocks
Learn how to identify institutional buying and selling zones and understand when Order Blocks are likely to remain valid.
Step 5
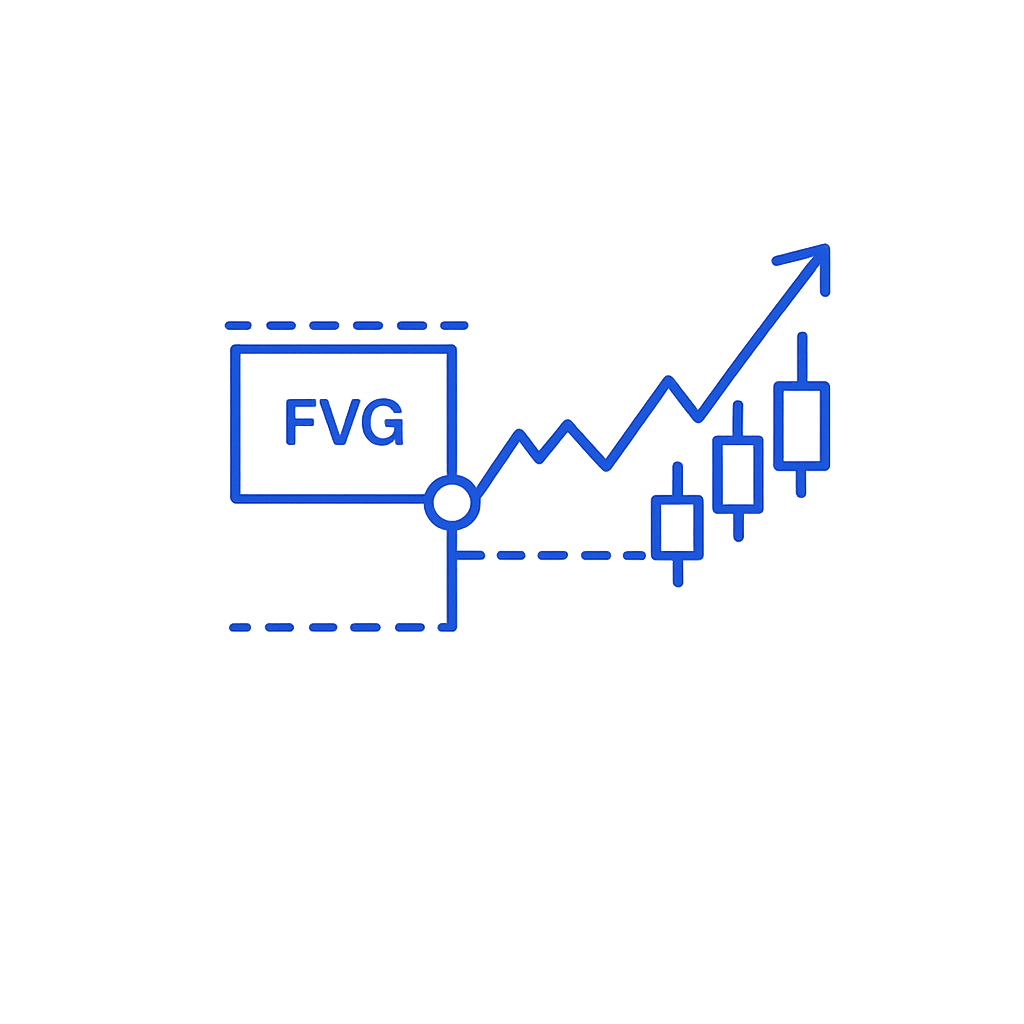
Fair Value Gap (FVG)
Understand market imbalances and how Fair Value Gaps can provide high-probability retracement and continuation opportunities.

Step 6
Premium & Discount
Use Premium and Discount zones with Fibonacci to determine whether price is trading at a favorable area for potential buying or selling.
Step 7
Trade Execution
Combine Market Structure, Liquidity, Order Blocks, and Fair Value Gaps to develop a structured trade entry process.
Step 8
Risk Management
Protect your trading capital through position sizing, stop-loss placement, and disciplined risk management practices.
SMC Basics: Build a Strong Trading Foundation
Before learning advanced Smart Money Concepts, it’s important to understand the basic principles of market movement.
Every trading setup starts with identifying the market trend and recognizing how price forms Higher Highs, Higher Lows, Lower Highs, and Lower Lows.
These concepts form the foundation of Market Structure analysis.

Market Trend
A market trend shows the overall direction of price movement.
Understanding the trend helps traders align their decisions with the current market direction.

Uptrend
An uptrend forms when price continues making Higher Highs (HH) and Higher Lows (HL), indicating bullish market conditions.

Downtrend
A downtrend forms when price creates Lower Highs (LH) and Lower Lows (LL), indicating bearish market conditions.

Range Market
A ranging market moves sideways without forming a clear trend.
During these conditions, price often trades between support and resistance.

Swing High & Swing Low
Swing Highs and Swing Lows are important turning points that help traders identify market structure and potential trend changes.

Why SMC Basics Matter
Every Smart Money Concept—whether BOS, CHoCH, Liquidity, Order Blocks, or Fair Value Gaps—depends on understanding these basic market principles first.
Market Structure: The Foundation of Smart Money Concepts
What is Market Structure?
Understanding Market Structure is the first and most important step in Smart Money Concepts (SMC).
Before traders analyze liquidity, Order Blocks, Fair Value Gaps (FVG), or Break of Structure (BOS), they must first understand how price moves and forms trends.
Market Structure provides the framework that institutional traders use to identify whether the market is bullish, bearish, or ranging.
Institutional traders do not make trading decisions based on individual candlesticks or random indicators.
Instead, they study the sequence of Higher Highs (HH), Higher Lows (HL), Lower Highs (LH), and Lower Lows (LL) to understand market direction.
This structured approach helps them identify the prevailing trend, anticipate potential reversals, and execute trades with greater confidence.
Every Smart Money Concepts strategy begins with Market Structure because it defines the overall market context.
Once you can correctly identify the market structure, concepts such as Break of Structure (BOS), Change of Character (CHoCH), Liquidity, Order Blocks, and Fair Value Gaps become much easier to understand.
For this reason, mastering Market Structure is the foundation of every successful SMC trading strategy.
Break of Structure (BOS):
How Smart Money Confirms Trend Continuation
What is Break of Structure (BOS)?
Break of Structure (BOS) is one of the most important concepts in Smart Money Concepts (SMC).
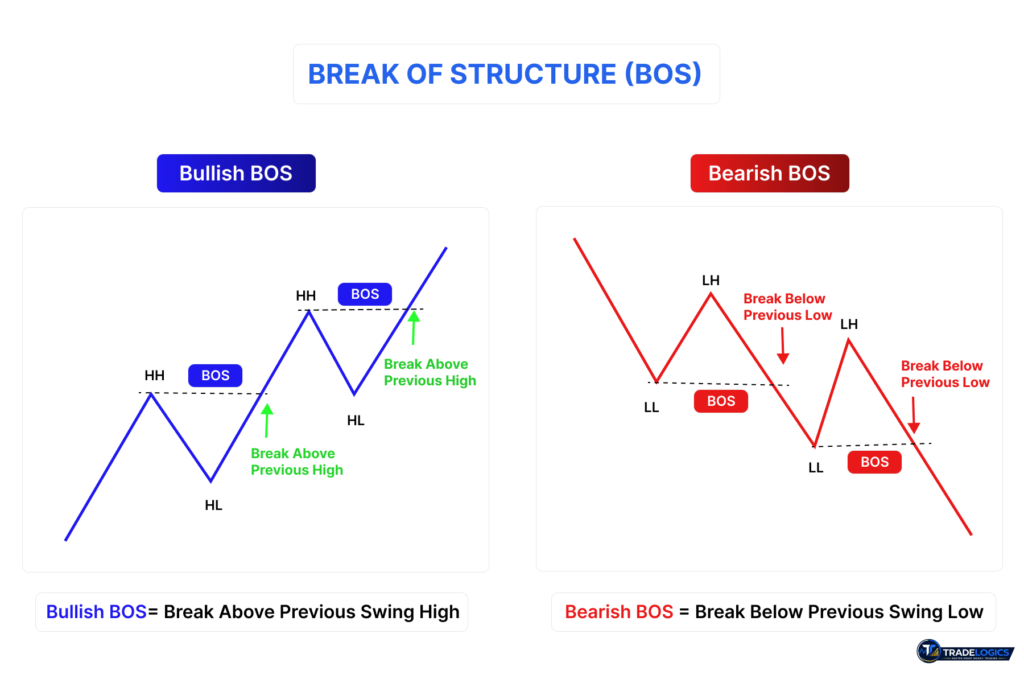
It occurs when price breaks a significant previous swing high or swing low, confirming that the current market trend is likely to continue.
Unlike random price movements, a valid BOS indicates that institutional buying or selling pressure is strong enough to overcome the previous market structure.
This confirmation helps traders avoid premature entries and trade in the direction of the dominant trend.
For this reason, professional traders use Break of Structure as a confirmation tool before looking for Order Blocks, Fair Value Gaps (FVGs), or trade entries.
Understanding Bullish Break of Structure
A Bullish BOS occurs when price breaks above a previous swing high (HH).
This confirms that buyers remain in control and the existing uptrend is likely to continue.
After the breakout, traders often wait for price to retrace into an Order Block, Fair Value Gap, or Discount Zone before entering a buy trade.
Waiting for this confirmation helps reduce false breakouts and improves trade quality.
Bullish BOS Checklist
- Price is making Higher Highs (HH) and Higher Lows (HL).
- Previous Swing High is broken.
- Market structure remains bullish.
- Look for buying opportunities after a valid retracement.
Understanding Bearish Break of Structure
A Bearish BOS occurs when price breaks below a previous swing low (LL).
This confirms that sellers have gained control and the existing downtrend is likely to continue.
Instead of selling immediately after the breakout, experienced traders usually wait for price to retrace into a Premium Zone, Bearish Order Block, or Fair Value Gap before entering a sell position.
Bearish BOS Checklist
- Price is making Lower Highs (LH) and Lower Lows (LL).
- Previous Swing Low is broken.
- Market structure remains bearish.
- Look for selling opportunities after a valid retracement.
Why Break of Structure Matters
Break of Structure helps traders identify whether the current trend is continuing or weakening.
Without BOS confirmation, traders may enter trades too early and become trapped in false market movements.
In Smart Money Concepts, BOS is rarely used alone.
It works best when combined with Market Structure, Liquidity, Order Blocks, Fair Value Gaps (FVGs), and Premium & Discount Zones.
Together, these concepts provide a structured framework for identifying high-probability trading opportunities.
Key Takeaways
- Break of Structure confirms trend continuation.
- Bullish BOS breaks above a previous Swing High.
- Bearish BOS breaks below a previous Swing Low.
- Wait for a retracement after BOS instead of chasing the breakout.
- Combine BOS with Order Blocks, FVGs, and Liquidity for higher-probability trade setups.
CHoCH (Change of Character): Identifying the First Sign of Trend Reversal
What is CHoCH (Change of Character)?
Change of Character (CHoCH) is a Smart Money Concepts (SMC) concept that signals the first indication of a potential market trend reversal.
Unlike a Break of Structure (BOS), which confirms the continuation of an existing trend, CHoCH suggests that the current trend may be losing momentum and a new trend could be forming.
Professional traders use CHoCH to identify early reversal opportunities before a complete market structure shift occurs.
What Does CHoCH Mean?
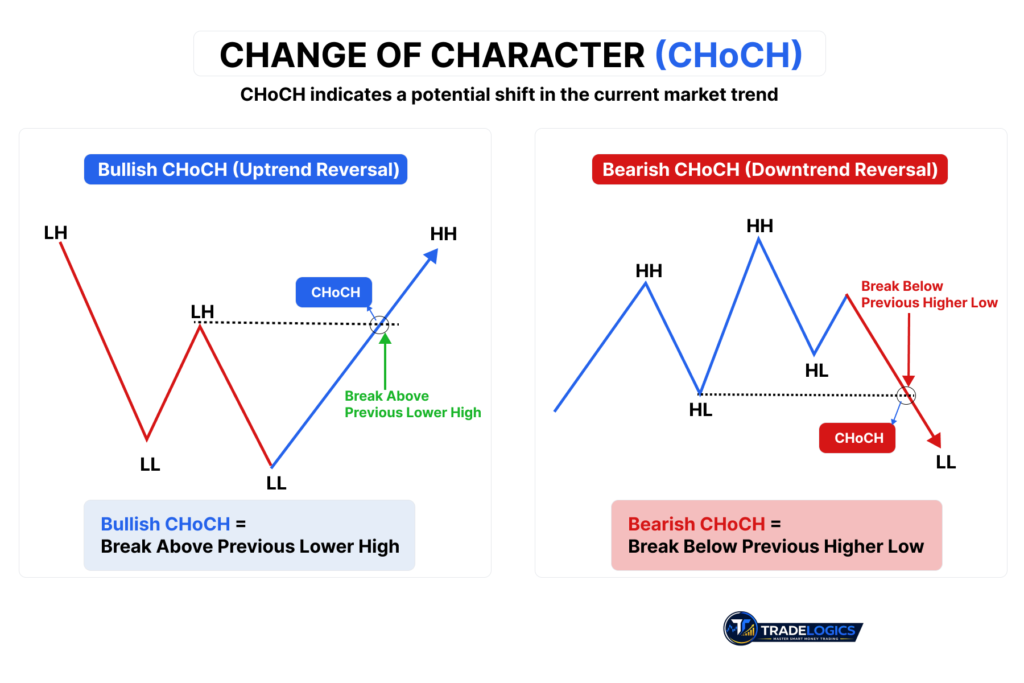
A Change of Character occurs when price breaks an important structural level against the current trend.
This break indicates that buyers or sellers may be taking control of the market.
Instead of confirming trend continuation, CHoCH warns traders that the market structure is beginning to change.
Bullish CHoCH
A Bullish CHoCH appears during a downtrend.
The market initially creates Lower Highs (LH) and Lower Lows (LL).
When price breaks above the previous Lower High, it suggests that buyers are becoming stronger and the bearish trend may be ending.
Bullish CHoCH Checklist
- Existing Downtrend
- Lower High (LH)
- Lower Low (LL)
- Price breaks above previous LH
- Potential Bullish Reversal
- Wait for confirmation before entering
Bearish CHoCH
A Bearish CHoCH appears during an uptrend.
The market forms Higher Highs (HH) and Higher Lows (HL).
When price breaks below the previous Higher Low, sellers begin taking control and the bullish trend may reverse.
Bearish CHoCH Checklist
- Existing Uptrend
- Higher High (HH)
- Higher Low (HL)
- Price breaks below previous HL
- Potential Bearish Reversal
- Wait for confirmation before entering
CHoCH vs Break of Structure (BOS)
Although both concepts involve market structure breaks, they serve different purposes.
| CHoCH | BOS |
|---|---|
| Indicates possible trend reversal | Confirms trend continuation |
| Early warning signal | Confirmation signal |
| Appears before trend changes | Appears during an existing trend |
| Used for reversal analysis | Used for continuation entries |
Understanding this difference helps traders avoid confusing a trend reversal with a normal continuation move.
Why CHoCH Matters
Professional traders monitor CHoCH because it provides an early warning before the market fully changes direction.
It helps traders:
- Detect possible trend reversals early
- Avoid entering late in the existing trend
- Prepare for new buying or selling opportunities
- Improve market structure analysis
- Trade with institutional market behavior
Common Mistakes Traders Make
Many beginners misunderstand CHoCH and enter trades immediately after the first structural break.
Some common mistakes include:
- Trading CHoCH without confirmation
- Ignoring higher timeframe market structure
- Confusing BOS with CHoCH
- Entering against strong higher timeframe momentum
- Ignoring liquidity and order blocks
Waiting for confirmation significantly improves trade quality.
How to Trade CHoCH
A disciplined Smart Money trader typically follows this process:
- Identify the current market trend.
- Wait for a valid CHoCH.
- Confirm the break with market structure.
- Look for Liquidity Sweep or Order Block.
- Wait for retracement.
- Enter only after confirmation.
- Manage risk with proper Stop Loss and Risk-to-Reward.
Key Takeaways
- CHoCH stands for Change of Character.
- It signals a potential trend reversal.
- Bullish CHoCH breaks above a previous Lower High.
- Bearish CHoCH breaks below a previous Higher Low.
- CHoCH is an early warning, while BOS confirms continuation.
- Always combine CHoCH with higher timeframe analysis and other Smart Money Concepts.
Frequently Asked Questions (FAQ)
Liquidity Sweep: How Smart Money Collects Liquidity Before the Real Move
What is Liquidity Sweep?
Liquidity Sweep is a Smart Money Concepts (SMC) strategy where institutional traders intentionally push price beyond obvious highs or lows to trigger stop-loss orders and collect liquidity before moving the market in the intended direction.
Retail traders often mistake these moves for genuine breakouts, but they are frequently liquidity grabs designed to fill large institutional orders.
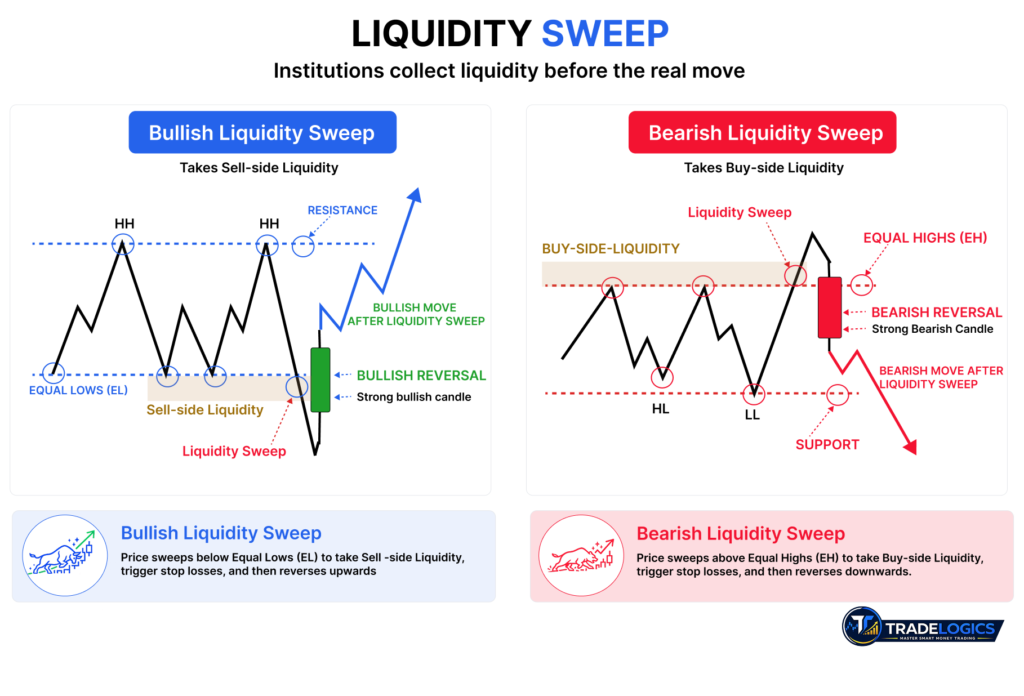
Why Does Liquidity Sweep Happen?
Large institutions cannot execute significant positions without enough opposing orders. They therefore target areas where many stop-losses and pending orders are concentrated.
Common liquidity zones include:
- Equal Highs (EH)
- Equal Lows (EL)
- Previous Swing Highs
- Previous Swing Lows
- Trendline Liquidity
Once liquidity is collected, price often reverses or accelerates in the intended direction.
Bullish Liquidity Sweep
A Bullish Liquidity Sweep occurs when price briefly moves below Equal Lows or a previous swing low, triggering sell-side liquidity.
After collecting those orders, buyers step in and push the market higher.
Bullish Checklist
- Existing bullish bias
- Liquidity below Equal Lows
- Price sweeps Sell-side Liquidity
- Strong bullish rejection
- Market Structure Confirmation
- Potential Buy Opportunity
Bearish Liquidity Sweep
A Bearish Liquidity Sweep occurs when price moves above Equal Highs or a previous swing high, triggering buy-side liquidity.
After collecting those orders, sellers regain control and drive the market lower.
Bearish Checklist
- Existing bearish bias
- Liquidity above Equal Highs
- Price sweeps Buy-side Liquidity
- Strong bearish rejection
- Market Structure Confirmation
- Potential Sell Opportunity
Common Mistakes Traders Make
Many traders lose money because they:
- Enter immediately after a breakout
- Ignore higher timeframe bias
- Confuse liquidity sweeps with genuine breakouts
- Trade without waiting for confirmation
- Ignore market structure
Patience and confirmation are essential when trading liquidity events.
Why Liquidity Sweep Matters
Understanding liquidity sweeps helps traders:
- Avoid false breakouts
- Identify institutional activity
- Improve trade timing
- Increase entry precision
- Align with Smart Money behavior
Key Takeaways
- Liquidity Sweep is an intentional liquidity grab by institutional traders.
- Bullish sweeps target Sell-side Liquidity.
- Bearish sweeps target Buy-side Liquidity.
- Wait for confirmation after the sweep instead of entering immediately.
- Combine Liquidity Sweep with CHoCH, BOS, Order Blocks, and Fair Value Gaps for higher-probability setups.
FAQ
Order Blocks in Smart Money Concepts
Order Blocks are one of the important concepts used in Smart Money Concepts (SMC) trading. Traders use them to identify potential areas where price may react after a strong impulsive move.
In simple terms, an Order Block is commonly identified as the last opposing candle before a strong price move. A bullish Order Block is associated with a strong move upward, while a bearish Order Block is associated with a strong move downward.
However, not every opposing candle should automatically be treated as an Order Block. Market structure, liquidity, the strength of the move, and price reaction should all be considered before using an Order Block as a trading zone.
What Is an Order Block?
An Order Block is a price zone identified around the last opposing candle before a strong impulsive move.
In the SMC framework:
- A Bullish Order Block is the last down candle before a strong bullish move.
- A Bearish Order Block is the last up candle before a strong bearish move.
The basic idea is that significant buying or selling activity is believed to have occurred around that area. When price later returns to the zone, traders watch for a reaction and possible continuation in the original direction.
Order Blocks can therefore act as potential:
- Demand or support zones
- Supply or resistance zones
- Entry areas after confirmation
- Areas for managing trade risk
The Order Block should be viewed as a potential reaction zone, not as a guaranteed entry signal.
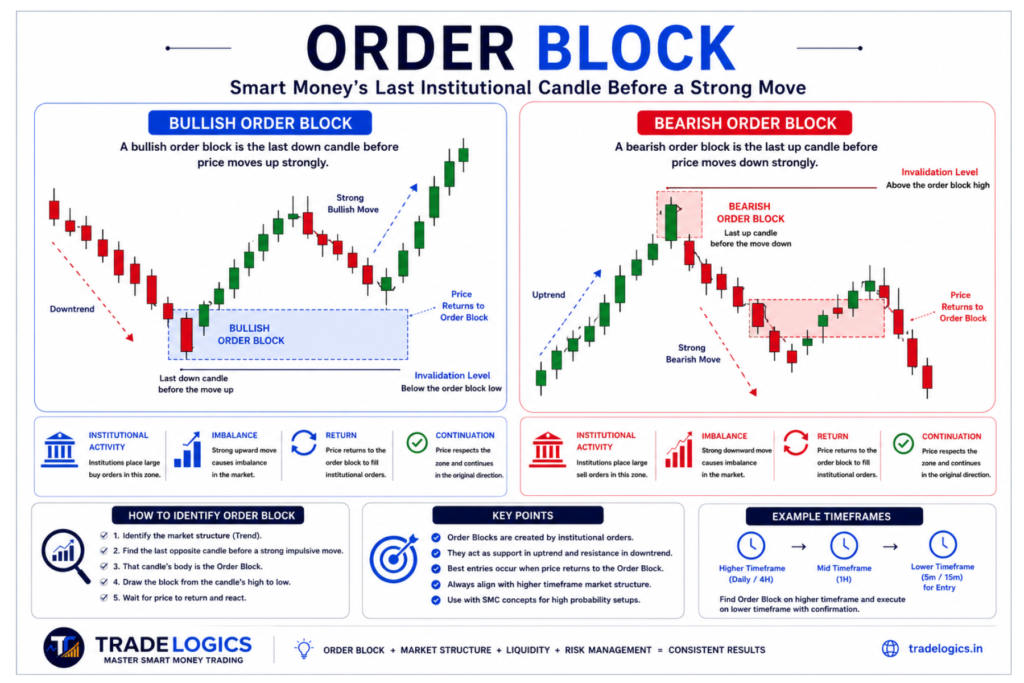
Bullish Order Block
A Bullish Order Block is commonly identified as the last down candle before a strong bullish move.
The sequence can be understood as:
Downtrend → Last Down Candle → Strong Bullish Move → Price Returns → Potential Bullish Reaction
When price moves strongly upward from this area, the zone created around the last bearish candle becomes a potential bullish Order Block.
When price later returns to the zone, traders look for evidence that buyers are defending the area.
How a Bullish Order Block Works
A typical bullish Order Block setup follows this structure:
- Price is moving downward or is trading within a bearish structure.
- A final bearish candle forms.
- Price then moves strongly upward.
- The strong move creates an imbalance or displacement in the market.
- Price later retraces toward the Order Block.
- Traders wait for confirmation before considering a long position.
- If price reacts from the zone and structure supports the setup, continuation may occur.
The Order Block itself is not the reason to enter a trade. The surrounding market context is important.
Bearish Order Block
A Bearish Order Block is commonly identified as the last up candle before a strong bearish move.
The sequence can be understood as:
Uptrend → Last Up Candle → Strong Bearish Move → Price Returns → Potential Bearish Reaction
When price moves strongly downward from this area, the zone around the final bullish candle becomes a potential bearish Order Block.
When price returns to the zone, traders watch for evidence that sellers are defending the area.
How a Bearish Order Block Works
A typical bearish Order Block setup follows this structure:
- Price is moving upward or is trading within a bullish structure.
- A final bullish candle forms.
- Price then moves strongly downward.
- The strong move creates displacement or imbalance.
- Price later retraces toward the Order Block.
- Traders wait for confirmation before considering a short position.
- If price rejects the zone and the broader structure supports the setup, continuation may occur.
How to Identify an Order Block
Identifying Order Blocks should be systematic rather than based on simply finding a candle that looks important.
Step 1: Identify the Market Structure
Start with the broader market structure.
Determine whether the market is:
- Bullish
- Bearish
- Ranging
Higher-timeframe structure should generally be considered before looking for lower-timeframe Order Blocks.
For example, if the Daily or 4H structure is bullish, bullish Order Blocks may receive more attention than bearish zones.
Step 2: Find the Last Opposing Candle
Look for the final candle moving against the direction of the strong impulse.
For a bullish Order Block:
Last bearish candle → Strong bullish displacement
For a bearish Order Block:
Last bullish candle → Strong bearish displacement
Step 3: Confirm the Strong Move
The move away from the candle is important.
A stronger Order Block setup generally has clear displacement rather than a slow, weak movement.
Look for:
- Strong directional candles
- Clear price expansion
- Break of an important structure level
- Momentum away from the zone
The stronger the move away from the zone, the more meaningful the area may become.
Step 4: Mark the Order Block Zone
Once the relevant candle has been identified, mark the appropriate price range according to your defined Order Block rules.
Consistency is important.
Do not change the way you mark the zone from one trade to another simply because you want the zone to fit the setup.
Step 5: Wait for Price to Return
An Order Block becomes particularly relevant when price returns to the zone.
Instead of entering immediately after identifying the zone, traders can wait for price to revisit it.
This allows the trader to combine the Order Block with additional confirmation.
Step 6: Look for Confirmation
Confirmation can come from other SMC concepts and price action.
Examples include:
- Market Structure Shift
- BOS
- CHoCH
- Liquidity Sweep
- FVG
- Rejection candle
- Lower-timeframe confirmation
This creates a more structured trading process than entering simply because price touched an Order Block.
Order Blocks and Market Structure
Market structure should remain the foundation of an Order Block setup.
A practical sequence is:
Higher-Timeframe Bias → Key Zone → Liquidity → Market Structure Shift → BOS/CHoCH → Order Block → Lower-Timeframe Confirmation → Entry → Stop Loss → Take Profit
This approach helps prevent traders from treating every Order Block as a standalone setup.
For example, a bullish Order Block inside a clearly bullish higher-timeframe structure may provide better context than a bullish Order Block that appears directly against a strong bearish trend.
Order Blocks and Liquidity
Liquidity can provide additional context for an Order Block.
Before price reacts from an Order Block, the market may first sweep liquidity around previous highs or lows.
For example:
Sell-Side Liquidity Sweep → Bullish Reaction → Market Structure Shift → Bullish Order Block → Retracement → Long Confirmation
Similarly:
Buy-Side Liquidity Sweep → Bearish Reaction → Market Structure Shift → Bearish Order Block → Retracement → Short Confirmation
This is why Order Blocks should be analyzed as part of the broader market narrative rather than in isolation.
Order Blocks and Fair Value Gaps
Order Blocks and Fair Value Gaps can sometimes appear together after a strong impulsive move.
A strong displacement from an Order Block may create an FVG. When price later retraces, the combination of:
Order Block + FVG + Market Structure
can provide additional confluence.
However, the presence of multiple concepts does not automatically make a trade high probability. The overall market context and risk management still matter.
Higher-Timeframe and Lower-Timeframe Analysis
Order Blocks can be analyzed across multiple timeframes.
A practical approach is:
Higher Timeframe — Daily / 4H
Identify the broader market structure and important Order Block zones.
Mid Timeframe — 1H
Refine the zone and analyze the developing market structure.
Lower Timeframe — 5M / 15M
Look for confirmation and execution opportunities.
This approach helps separate context from execution.
Instead of searching for an entry immediately on a lower timeframe, first determine where price is positioned on the higher timeframe.
How to Trade an Order Block
An Order Block should be treated as a zone where the trader becomes interested, not automatically as an entry signal.
A structured process can be:
For a Bullish Setup
- Establish a bullish higher-timeframe bias.
- Identify a relevant bullish Order Block.
- Wait for price to return to the zone.
- Check whether liquidity has been taken.
- Look for a lower-timeframe market structure shift.
- Confirm with BOS, CHoCH, FVG, or price action where appropriate.
- Define the invalidation level.
- Calculate position size based on the predetermined risk.
- Execute only if the complete setup meets the trading plan.
For a Bearish Setup
- Establish a bearish higher-timeframe bias.
- Identify a relevant bearish Order Block.
- Wait for price to return to the zone.
- Check for buy-side liquidity conditions.
- Look for a lower-timeframe market structure shift.
- Confirm with BOS, CHoCH, FVG, or price action where appropriate.
- Define the invalidation level.
- Calculate position size based on the predetermined risk.
- Execute only if the complete setup meets the trading plan.
Order Block Invalidation
An Order Block should have a clearly defined invalidation point.
For a bullish Order Block, the invalidation level may be placed below the relevant Order Block low according to the trader’s rules.
For a bearish Order Block, the invalidation level may be placed above the relevant Order Block high.
The exact stop placement should be determined by the trading plan and market structure rather than by an arbitrary fixed number of points.
The key principle is:
If the price action invalidates the reason for the trade, the setup is no longer valid.
Common Order Block Mistakes
1. Treating Every Opposite Candle as an Order Block
Not every bearish candle before an upward move is automatically a high-quality bullish Order Block.
The strength and significance of the move should be considered.
2. Ignoring Higher-Timeframe Structure
A lower-timeframe Order Block can look attractive while completely opposing the broader market structure.
Always establish the larger context first.
3. Entering Without Confirmation
Price touching an Order Block does not guarantee a reversal.
Waiting for confirmation can help reduce low-quality entries.
4. Drawing Too Many Order Blocks
Marking every possible Order Block creates chart clutter and makes decision-making difficult.
Focus on the zones that have meaningful market context.
5. Ignoring Liquidity
An Order Block can become more meaningful when it fits into a clear liquidity narrative.
Understanding where liquidity is located can help explain why price may move into or away from a zone.
6. Using Order Blocks Without Risk Management
Even a technically strong setup can fail.
Risk should be defined before entering the trade, and position size should be calculated according to the predetermined risk.
Order Block Trading Checklist
Before considering an Order Block setup, ask:
- Is the higher-timeframe market structure clear?
- Is the Order Block aligned with the broader bias?
- Is this genuinely the last opposing candle before a strong move?
- Was there clear displacement away from the zone?
- Has relevant liquidity been considered?
- Has price returned to the Order Block?
- Is there lower-timeframe confirmation?
- Is there a clear invalidation level?
- Is the risk acceptable?
- Does the setup meet the complete trading plan?
If several important conditions are missing, the best decision may be to wait.
Order Blocks in Smart Money Concepts
Order Blocks become more useful when they are connected with the rest of the SMC framework.
The broader sequence can be viewed as:
Market Structure → Liquidity → BOS/CHoCH → Order Block → FVG → Premium & Discount → Trade Execution
Each concept answers a different question.
Market Structure: What direction is the market showing?
Liquidity: Where could price be drawn before the next move?
BOS/CHoCH: Has the market structure changed or continued?
Order Block: Where did the strong move originate?
FVG: Did the displacement leave an imbalance?
Premium & Discount: Is price positioned in a favorable area within the relevant range?
Trade Execution: Where can risk be clearly defined?
This connected approach is more powerful than memorizing individual SMC patterns.
Key Takeaways
- An Order Block is commonly identified as the last opposing candle before a strong impulsive move.
- Bullish Order Blocks are associated with strong upward moves.
- Bearish Order Blocks are associated with strong downward moves.
- Not every opposing candle is a high-quality Order Block.
- Market structure should be considered before selecting an Order Block.
- Liquidity, BOS/CHoCH, FVG, and price action can provide additional confirmation.
- Price returning to an Order Block does not guarantee a reaction.
- Every setup should have a clear invalidation level and predefined risk.
- Higher-timeframe analysis can provide context while lower-timeframe analysis can be used for confirmation.
- Order Blocks should be treated as part of a complete trading framework rather than as standalone signals.
Frequently Asked Questions
What is an Order Block in SMC?
An Order Block is commonly identified as the last opposing candle before a strong impulsive price move. Traders use the resulting zone as a potential area of support or resistance.
What is a Bullish Order Block?
A Bullish Order Block is generally the last bearish candle before a strong bullish move. When price returns to the zone, traders may look for bullish confirmation.
What is a Bearish Order Block?
A Bearish Order Block is generally the last bullish candle before a strong bearish move. When price returns to the zone, traders may look for bearish confirmation.
Does price always react from an Order Block?
No. Order Blocks are potential reaction zones, not guaranteed reversal or continuation areas. Price can move through an Order Block and invalidate the setup.
Which timeframe is best for Order Blocks?
There is no single best timeframe. Higher timeframes such as Daily and 4H can provide context, while 1H, 15M, or 5M can be used for refinement and confirmation depending on the trading plan.
Should I enter immediately when price touches an Order Block?
Not necessarily. Many traders wait for additional confirmation such as a liquidity sweep, market structure shift, BOS, CHoCH, FVG interaction, or rejection before entering.
Conclusion
Order Blocks provide a structured way to study where significant price moves may have originated.
The key is not simply to identify a candle and assume that price will reverse from it. A stronger approach is to combine the Order Block with higher-timeframe market structure, liquidity, displacement, BOS or CHoCH, FVG, price action, and disciplined risk management.
For SMC traders, the real value of an Order Block comes from understanding its position within the complete market narrative.
Structure first. Liquidity next. Confirmation before execution. Risk always defined.