
Market Structure Through Dow Theory: Understanding Trends, HH, HL, LH and LL
Dow Theory Market Structure is the foundation of the TradeLogics Smart Money Concepts learning framework. It helps traders understand how price moves, how trends develop, and how to identify the overall direction of a market.
For this first step, it is important to understand the traditional foundation behind market direction before moving into later concepts such as BOS, CHoCH, Liquidity, Order Blocks, or Fair Value Gaps.
That foundation is Dow Theory.
Dow Theory is one of the earliest and most influential frameworks for understanding market trends. Developed from the writings of Charles H. Dow, it introduced the idea that markets move in recognizable trends and that price action can be studied through the sequence and behavior of market movements.
Modern traders often describe market structure using terms such as:
- Higher High (HH)
- Higher Low (HL)
- Lower High (LH)
- Lower Low (LL)
These terms provide a practical way to visualize the directional behavior that Dow Theory attempts to explain.
In simple terms:
Higher Highs + Higher Lows = Rising Market Structure
Lower Highs + Lower Lows = Falling Market Structure
Understanding why these sequences matter is the purpose of this article.
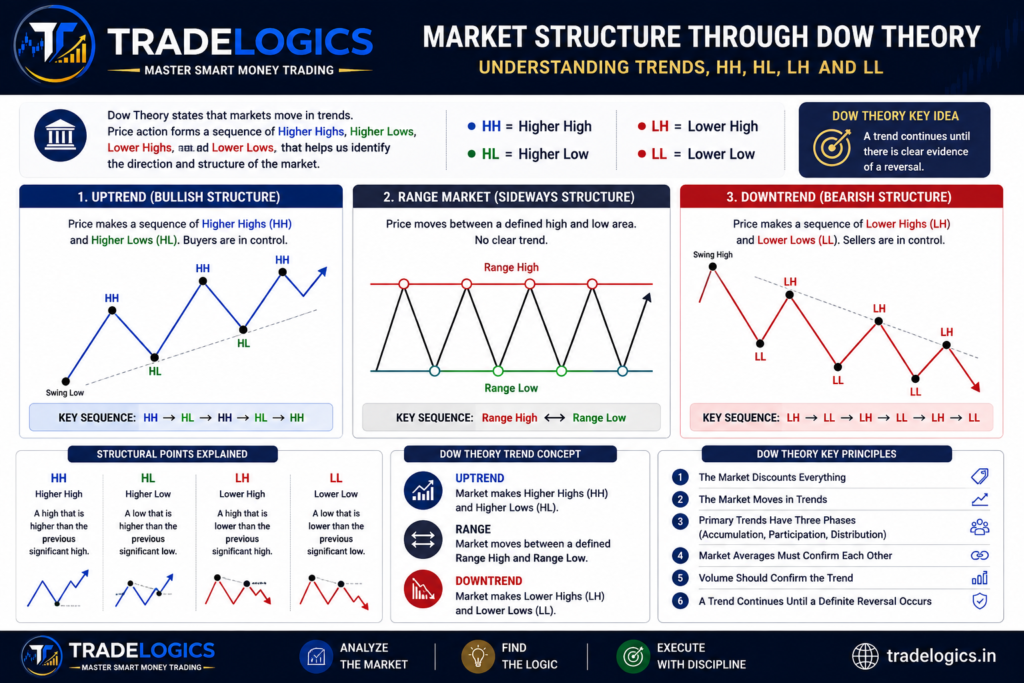
What Is Dow Theory?
Dow Theory is a framework for analyzing financial markets by studying price movement, trends, market phases, and confirmation between related market averages.
Charles H. Dow developed many of the ideas through his editorials in the Wall Street Journal during the late nineteenth century. Although Dow did not create a modern trading system with specific entry signals, his observations became the foundation for much of classical technical analysis.
The central idea is straightforward:
Markets move in trends, and those trends can be identified by studying price behavior over time.
Rather than attempting to predict every individual price movement, Dow Theory encourages traders to identify the broader direction of the market first.
This principle remains highly relevant today.
A trader can apply the same basic thinking to modern charts by asking:
Is the market making progressively higher highs and higher lows, or progressively lower highs and lower lows?
That question is at the heart of market structure analysis.
The Six Core Principles of Dow Theory
Dow Theory is commonly explained through six major principles.
These principles provide the conceptual foundation for understanding market trends.
1. The Market Discounts Everything
Dow Theory assumes that available information is reflected in market prices.
Economic conditions, expectations, news, investor sentiment, corporate developments, and other relevant information can influence price.
Therefore, instead of attempting to analyze every individual piece of information separately, Dow Theory places significant importance on studying the behavior of price itself.
For a technical trader, this creates an important principle:
Price is the primary observable evidence of market behavior.
A market may appear fundamentally strong, but if price continues to decline, the actual market behavior must be taken seriously.
Likewise, negative news does not automatically mean that price must continue falling if the market is already absorbing that information and beginning to rise.
The trader’s job is therefore not simply to predict what should happen.
The trader observes what the market is actually doing.
2. The Market Moves in Trends
One of the most important principles of Dow Theory is that markets move in trends.
Dow Theory traditionally divides trends into three categories:
- Primary trend
- Secondary trend
- Minor trend
Understanding these different levels is essential because a market can be bullish on one timeframe while temporarily moving lower on another.
Primary Trend
The primary trend represents the major directional movement of the market.
It can be:
- Bullish
- Bearish
A primary bullish trend represents a sustained upward movement.
A primary bearish trend represents a sustained downward movement.
For a modern trader, the primary trend can be thought of as the broader market direction.
For example:
Bullish Primary Trend
Price generally progresses upward.
Bearish Primary Trend
Price generally progresses downward.
The primary trend is more important than short-term fluctuations.
Secondary Trend
A secondary trend is a correction or counter-movement against the primary trend.
For example, a market may be in a long-term bullish trend but experience a significant temporary decline.
The larger trend can remain bullish while the secondary movement is bearish.
Similarly, a market can remain bearish overall while experiencing a temporary upward correction.
This distinction is important because traders can easily mistake a correction for a complete trend reversal.
A simplified example:
Primary Bullish Trend
Higher High
↓
Higher Low
↓
Higher High
↓
Temporary Correction
↓
New Higher Low
↓
Continuation
The correction does not automatically destroy the larger bullish structure.
Minor Trend
The minor trend represents shorter-term price movements within the larger market structure.
These movements can occur inside both primary and secondary trends.
For example, during a bullish primary trend, price may experience several short-term bearish and bullish movements before continuing higher.
This creates multiple layers of market behavior.
A useful way to visualize the relationship is:
Primary Trend → Secondary Trend → Minor Trend
The smaller movement exists within the larger movement.
This is one reason why market structure should always be interpreted relative to timeframe.
3. Primary Trends Have Three Phases
Dow Theory also describes three major phases within a primary trend.
For a bullish market, these phases are commonly described as:
- Accumulation
- Public participation
- Distribution
Phase 1: Accumulation
Accumulation represents the stage where informed market participants begin accumulating positions after a period of decline or uncertainty.
The broader market may not yet recognize the potential change in conditions.
Price can remain relatively quiet or move within a range.
At this stage, the market may not yet display a clear sustained uptrend.
The important idea is that the market can begin changing beneath the surface before the majority of participants recognize the change.
Phase 2: Public Participation
As the market begins establishing a clearer upward trend, more participants recognize the movement.
Price begins to advance more consistently.
This is often the strongest and most recognizable phase of a bullish trend.
Modern traders may observe a sequence such as:
HH → HL → HH → HL → HH
The market is demonstrating sustained upward behavior.
Phase 3: Distribution
During distribution, experienced participants may begin reducing or distributing positions after a significant advance.
The market can remain elevated while the underlying strength of the trend begins to weaken.
Eventually, the market may transition into a broader decline.
The three phases therefore describe how a major bullish movement can develop from early positioning to broad participation and eventually distribution.
Bear Market Phases
Dow Theory also describes three phases for a primary bearish trend.
These are commonly represented as:
- Distribution
- Public participation
- Panic or despair
Phase 1: Distribution
After a prolonged advance, informed participants may begin reducing exposure.
The market can remain relatively strong while distribution takes place.
Phase 2: Public Participation
As weakness becomes more visible, more market participants recognize the declining trend.
Selling pressure increases.
The market begins producing increasingly lower prices.
Phase 3: Panic or Despair
During the final phase, selling can become aggressive as confidence deteriorates.
Participants may exit positions rapidly, creating significant downward movement.
Eventually, the market can reach conditions where another accumulation process begins.
4. Market Averages Must Confirm Each Other
One of the original principles of Dow Theory was that related market averages should confirm one another.
Historically, Dow compared industrial and railroad averages.
The basic idea was that a major economic trend should be reflected across related parts of the market.
If one average was rising while another failed to confirm the movement, Dow considered the signal less reliable.
Modern traders do not necessarily apply this principle using the original Dow averages, but the underlying concept remains useful:
A major market movement becomes more convincing when independent or related evidence supports the same directional conclusion.
This idea of confirmation is important when analyzing markets today.
However, the original Dow Theory principle should not be confused with simply looking for multiple indicators that produce the same signal.
The objective is confirmation of the broader market movement.
5. Volume Should Confirm the Trend
Dow Theory also gives importance to trading volume.
Volume should generally support the direction of the primary trend.
In a healthy bullish trend, increasing volume during upward price movements can provide confirmation of buying participation.
In a bearish trend, increasing volume during downward movements can support the presence of selling pressure.
Volume should therefore be considered alongside price rather than interpreted independently.
For example:
Price Rising + Increasing Volume
can provide stronger confirmation of bullish participation.
Similarly:
Price Falling + Increasing Volume
can provide stronger confirmation of bearish participation.
However, volume is supporting evidence, not a standalone reason to enter a trade.
Price structure remains central to the analysis.
6. A Trend Continues Until a Definite Reversal Occurs
This is one of the most important practical ideas in Dow Theory.
A trend should be considered active until there is sufficient evidence that the trend has actually reversed.
For example, if a market is consistently producing:
Higher High → Higher Low → Higher High → Higher Low
a trader should not automatically declare the trend bearish simply because price experiences a temporary decline.
The trader needs evidence that the existing directional structure has genuinely changed.
The same principle applies to a bearish market.
If price continues producing:
Lower Low → Lower High → Lower Low → Lower High
a temporary rally does not automatically mean that the market has become bullish.
This principle helps traders avoid reacting to every short-term fluctuation.
Understanding Market Direction Through Price Structure
The concepts of Higher High, Higher Low, Lower High, and Lower Low provide a practical way to translate the broader ideas of Dow Theory into chart analysis.
Higher High (HH)
A Higher High occurs when price forms a significant high above the previous significant high.
Example:
Previous High → New Higher High
This demonstrates that buyers have been able to push price beyond a previous important level.
A sequence of Higher Highs is commonly associated with an upward market.
Higher Low (HL)
A Higher Low occurs when price forms a significant low above the previous significant low.
Example:
Previous Low → New Higher Low
The Higher Low is important because it demonstrates that sellers were unable to push price back to the previous low.
When HHs and HLs develop together, they create a bullish structural sequence.
Bullish Structure
HH → HL → HH → HL → HH
This is one of the clearest ways to visualize an upward market.
Lower High (LH)
A Lower High occurs when price forms a significant high below the previous significant high.
Example:
Previous High → New Lower High
This indicates that buyers were unable to push price back above the previous significant high.
A sequence of Lower Highs is commonly associated with bearish market behavior.
Lower Low (LL)
A Lower Low occurs when price forms a significant low below the previous significant low.
Example:
Previous Low → New Lower Low
This demonstrates that sellers have been able to push price below the previous significant low.
When Lower Highs and Lower Lows develop together, they create a bearish structural sequence.
Bearish Structure
LL → LH → LL → LH → LL
This is a simple visual representation of a declining market.
The Basic Market Structure Sequences
The four structural points can be combined to identify the broader directional condition.
Bullish Market
A bullish market generally develops through:
Higher High → Higher Low → Higher High → Higher Low
The important characteristic is that both highs and lows are progressing upward.
The market is not simply moving upward in a straight line.
Instead, it moves through advances and pullbacks.
The pullbacks create Higher Lows, while the advances create Higher Highs.
This is what creates the structure of an uptrend.
Bearish Market
A bearish market generally develops through:
Lower Low → Lower High → Lower Low → Lower High
The market moves downward through a sequence of declines and corrections.
The declines create Lower Lows.
The corrections create Lower Highs.
Together, these create a bearish structural sequence.
Why Pullbacks Are Important
A trend does not normally move in a straight line.
Markets advance, correct, consolidate, and then potentially continue.
This is why the relationship between highs and lows is more useful than simply looking at whether the latest candle is bullish or bearish.
Consider a bullish market:
HH → HL → HH
The movement from HH down to HL is a pullback.
The important question is not:
“Did price move down?”
The better question is:
“Where did the pullback stop relative to the previous structural low?”
If the market creates a Higher Low and then advances toward a new Higher High, the broader bullish structure remains intact.
The same logic can be applied in reverse to a bearish market.
Market Structure and time frames
Market structure exists on multiple time frames.
A Daily chart can show a broad structural trend while the H1 chart shows several smaller movements inside that trend.
For example:
Daily: Bullish
H4: Bullish with a temporary correction
H1: Short-term bearish movement
There is no necessary contradiction.
The H1 movement can simply represent a smaller movement occurring inside the larger Daily structure.
This is why traders should always ask:
“Which timeframe am I analyzing?”
A Higher High on a 5-minute chart does not necessarily have the same significance as a Higher High on a Daily chart.
The importance of a structural point depends on its context, timeframe, and influence on subsequent price movement.
How to Identify a Trend Using Dow Theory
A practical market structure analysis can begin with a simple process.
Step 1: Identify Significant Swing Points
Start by locating meaningful highs and lows.
Avoid marking every minor fluctuation.
The goal is to identify the swings that meaningfully influence price movement.
Step 2: Compare Highs
Ask:
Is the latest significant high above or below the previous significant high?
If it is higher:
Higher High (HH)
If it is lower:
Lower High (LH)
Step 3: Compare Lows
Next, compare significant lows.
If the latest significant low is above the previous significant low:
Higher Low (HL)
If it is below:
Lower Low (LL)
Step 4: Identify the Sequence
Now combine the observations.
Bullish
HH + HL
Bearish
LH + LL
Unclear or Transitional
If the sequence is mixed, the market may be consolidating, correcting, or transitioning.
This is where patience becomes important.
Range and Sideways Markets
Not every market is trending.
Sometimes price moves between relatively defined upper and lower areas without consistently creating a sequence of higher highs and higher lows or lower highs and lower lows.
This is a range or sideways market.
A simplified structure is:
Range High
↓
Price moves lower
Range Low
↑
Price moves higher
Range High
During such conditions, attempting to force a bullish or bearish trend interpretation can create unnecessary trading decisions.
The first responsibility of a market structure trader is therefore not to find a trend.
It is to correctly identify the market condition.
The Difference Between a Pullback and a Trend Reversal
This is one of the most important applications of Dow Theory.
Suppose a market is moving upward:
HH → HL → HH
Price then begins moving lower.
The decline alone does not prove that the bullish trend has ended.
The trader should observe whether the market continues to respect the relevant bullish structure.
A temporary decline can simply be a correction.
The same principle applies to a bearish market.
If the market is producing:
LL → LH → LL
and then rallies, the rally alone does not prove that the bearish trend has ended.
This is why Dow Theory emphasizes waiting for meaningful evidence before declaring a trend reversal.
Structural Strength and Market Direction
The sequence of highs and lows can also provide information about the strength of directional movement.
Consider two bullish markets.
Market A
HH → HL → HH → HL → HH
This shows a relatively clear upward progression.
Market B
HH → HL → Slight New High → Deep Pullback
The second market may require more caution because the structural progression is becoming less clean.
The trader should not rely solely on the number of bullish candles.
Instead, observe how price is forming meaningful highs and lows.
This is the essence of structural analysis.
Dow Theory and Modern Market Structure
Modern price-action traders frequently use HH, HL, LH, and LL terminology.
These terms provide a simple visual language for describing market direction.
However, it is useful to understand that the terminology itself is a modern trading framework, while the underlying idea of identifying trends through successive market movements is deeply connected to Dow Theory.
In other words:
Dow Theory provides the foundational trend framework.
HH, HL, LH, and LL provide a practical chart-based language for describing that structure.
This distinction is important because it prevents traders from treating market structure as a collection of isolated labels.
The labels are useful because they describe the behavior of price.
A Practical Market Structure Example
Imagine that price begins from a significant low.
It rallies and creates a new high.
That becomes:
HH
Price then pulls back but stops above the previous low.
That becomes:
HL
Price rallies again and creates another new high.
That becomes:
HH
Price pulls back again but remains above the previous structural low.
That becomes:
HL
The sequence is:
HH → HL → HH → HL
The market is demonstrating a bullish structure.
Now consider the opposite sequence.
Price falls and creates a new low:
LL
Price rallies but fails to reach the previous high:
LH
Price falls again and creates another new low:
LL
Price rallies again but forms another lower high:
LH
The sequence becomes:
LL → LH → LL → LH
The market is demonstrating bearish structure.
Common Mistakes When Reading Dow Theory
Mistake 1: Treating Every Candle as Structure
A single bullish or bearish candle does not define a trend.
Market structure develops through meaningful sequences of price movement.
Mistake 2: Ignoring Timeframe
A short-term movement can occur inside a larger trend.
Always know which timeframe your structural analysis represents.
Mistake 3: Calling Every Pullback a Reversal
A correction against the trend does not automatically mean that the primary trend has ended.
Mistake 4: Forcing a Trend in a Range
If price is moving sideways, there may not be a clean bullish or bearish sequence.
Recognizing a range is also market analysis.
Mistake 5: Marking Too Many Swing Points
Excessive markings can make the chart difficult to read.
Focus on meaningful structural highs and lows.
Mistake 6: Looking for Entries Before Understanding Direction
Market structure should answer the basic question:
What is price currently doing?
Only after that question has been addressed should a trader begin considering a specific trading opportunity.
Market Structure Checklist
Before moving to the next stage of your analysis, ask:
- What is the primary market direction?
- What timeframe am I analyzing?
- Where are the significant swing highs?
- Where are the significant swing lows?
- Is price creating Higher Highs?
- Is price creating Higher Lows?
- Is price creating Lower Highs?
- Is price creating Lower Lows?
- Is the market trending or ranging?
- Is the current movement a continuation or a correction?
- Is there enough evidence to suggest a genuine change in the broader trend?
This simple process can prevent many common errors in market analysis.
Key Takeaways
- Dow Theory is one of the foundational frameworks for understanding market trends.
- Markets can be analyzed through primary, secondary, and minor trends.
- A bullish market generally develops through Higher Highs and Higher Lows.
- A bearish market generally develops through Lower Highs and Lower Lows.
- Pullbacks are normal components of trending markets.
- A temporary counter-trend movement does not automatically mean a trend reversal.
- Volume can provide supporting evidence for the prevailing trend.
- Major market movements can be evaluated through confirmation.
- Market structure should always be interpreted relative to timeframe.
- The sequence of highs and lows is more informative than individual candles.
- Not every market is trending; recognizing a range is equally important.
- HH, HL, LH, and LL provide a practical modern language for describing market structure.
Frequently Asked Questions
What is Dow Theory in trading?
Dow Theory is a foundational framework for understanding market trends by studying price movement, trend direction, market phases, volume, and confirmation.
What are the three types of trends in Dow Theory?
Dow Theory traditionally identifies three levels of trends: primary, secondary, and minor trends.
What is a Higher High?
A Higher High occurs when price forms a significant high above the previous significant high.
What is a Higher Low?
A Higher Low occurs when price forms a significant low above the previous significant low.
What is a Lower High?
A Lower High occurs when price forms a significant high below the previous significant high.
What is a Lower Low?
A Lower Low occurs when price forms a significant low below the previous significant low.
How do HH and HL identify an uptrend?
A repeated sequence of Higher Highs and Higher Lows indicates that price is progressively moving upward and is commonly used to identify bullish market structure.
How do LH and LL identify a downtrend?
A repeated sequence of Lower Highs and Lower Lows indicates that price is progressively moving downward and is commonly used to identify bearish market structure.
Can a bullish market temporarily move downward?
Yes. A bullish market can experience secondary or minor corrections without immediately changing its broader trend.
Why is timeframe important in market structure?
Market structure exists at different levels. A short-term trend can occur inside a larger-term trend, so the significance of a structural movement depends on the timeframe being analyzed.
Conclusion
Market Structure begins with a simple but powerful question:
What is the market actually doing?
Dow Theory provides the foundation for answering that question.
Instead of attempting to predict every short-term price movement, traders can study the sequence of significant highs and lows to understand the broader direction of the market.
A bullish market generally creates:
Higher High → Higher Low → Higher High → Higher Low
A bearish market generally creates:
Lower Low → Lower High → Lower Low → Lower High
These sequences provide a practical framework for identifying market direction and understanding whether price is trending, correcting, or moving sideways.
The most important lesson is that market structure is not about labeling every candle. It is about understanding the relationship between meaningful price swings over time.
Once a trader can consistently identify the broader trend and distinguish a genuine structural movement from a temporary fluctuation, the chart becomes much easier to interpret.
This is why Market Structure is Step 1 of the TradeLogics Smart Money Concepts learning framework.
The next step in the TradeLogics sequence is Step 2 — Break of Structure (BOS) & Change of Character (CHoCH).
Once you understand market structure, the next step is learning how Break of Structure (BOS) and Change of Character (CHoCH) help traders interpret continuation and potential changes in market direction.