XAUUSD PPI Trade Case Study: 1-Minute Sell Setup After 2 Stop Losses
Introduction
This XAUUSD PPI Trade Case Study shows how I approached a high-impact U.S. economic data session using higher-time-frame analysis and 1-minute price action confirmation.
On this XAUUSD trade, I prepared the higher-time frame charts before the American session and marked the important Demand Zones, Supply Zones, Support, and Resistance levels.
The main focus was not to predict the entire move in advance. Instead, I wanted to understand how price would react around the important levels and then use the 1-minute chart for confirmation.
During the PPI session, price first moved toward the 4,401 area and then dropped toward the 4,381 area. The first two trade attempts failed. However, after further market structure confirmation, the later Sell setups provided a much clearer opportunity.
This case study is important because it shows why a trader must distinguish between an initial idea and a confirmed setup. It also shows how repeated 1-minute Market Structure Breakouts and Fibonacci 0.50 retracements can create multiple execution opportunities during a volatile session.
Market Overview
Before the American session, I analyzed XAUUSD across the Daily, 4-hour, and 1-hour charts.
My preparation included marking:
- Important Demand Zones
- Important Supply Zones
- higher-time-frame Support
- higher-time-frame Resistance
- Daily levels
- H4 levels
- H1 levels
- The broader Market Structure
The Daily chart showed the larger market context, including the Daily Demand Zone and several resistance levels above the current price.
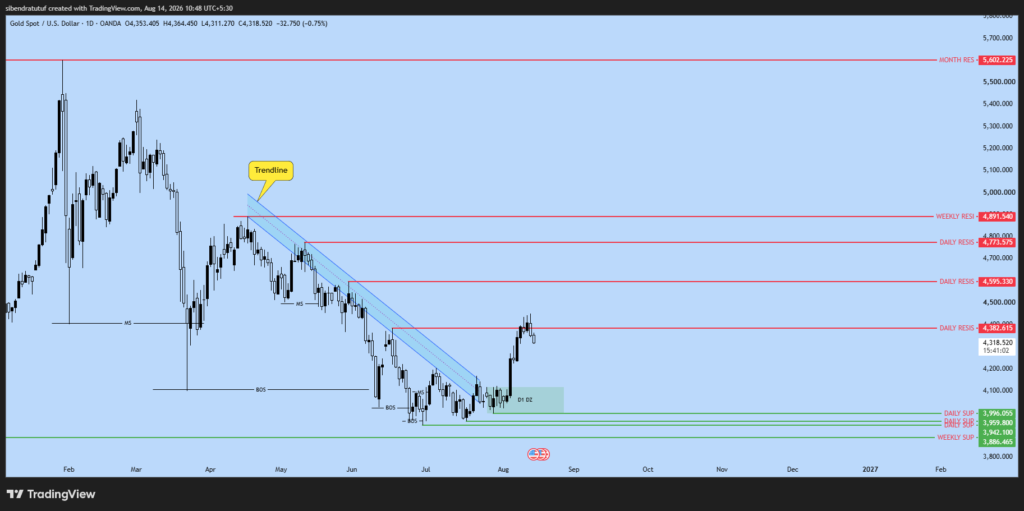
On the Daily chart, the major levels visible on my analysis included Daily Resistance around 4,382.615 and the Daily Demand Zone around the 4,000 area.
The chart also showed a descending trendline and previous Market Structure levels. Price had already reacted strongly from the lower Demand Zone and moved upward toward the 4,382 area.
Chart Source: All charts in this case study were analyzed using TradingView.
Higher Timeframe Analysis
I then moved to the 4-hour chart to understand the structure more clearly.
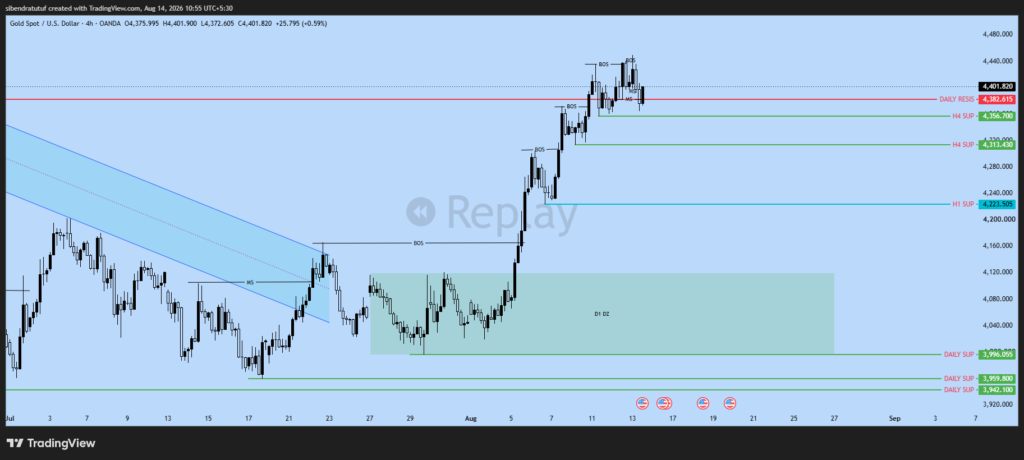
The H4 chart showed a strong bullish move from the Daily Demand Zone. Price broke several previous structural levels and continued higher.
However, after reaching the upper area around 4,400–4,440, the price action became more corrective and began forming Market Structure changes.
The important H4 levels I had marked included:
- H4 Support around 4,356.700
- H4 Support around 4,313.430
- H1 Support around 4,223.505
- Daily Resistance around 4,382.615
Therefore, my preparation was not based only on the 1-minute chart. I already knew where the important higher-time frame levels were before looking for an entry.
Multi-Timeframe Analysis
My approach for this trade was:
Higher Timeframe → Identify important levels
1-Minute Timeframe → Wait for price-action confirmation
The higher-time frame charts helped me understand where price was located in the overall structure.
After that, I opened the 1-minute chart to study the reaction around the important levels.
This was particularly important because the PPI session produced fast movements. Instead of entering simply because price reached a level, I wanted to see a Market Structure Shift or Break of Structure on the 1-minute chart.
Lower Timeframe Analysis
Price initially moved toward the 4,401 high.
After reaching this area, price moved lower toward the 4,381 area during the PPI session.
On the 1-minute chart, this downward movement created a new Market Structure Shift to the downside.
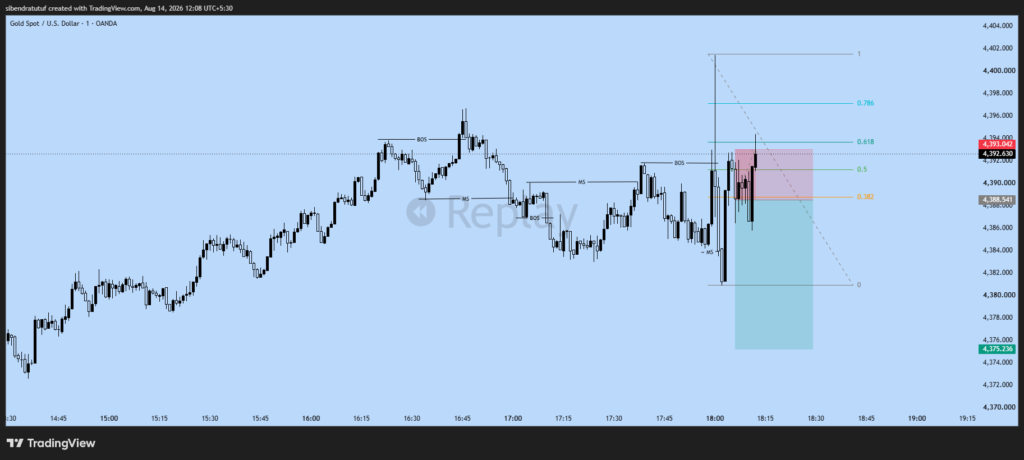
At this point, I applied the Fibonacci tool to the move.
Price retraced toward the Fibonacci 0.50 level. During this retracement, an Evening Star candle appeared.
This was the first Sell confirmation I used.
My logic was:
Market Structure Shift → Fibonacci 0.50 Retracement → Evening Star → Sell
I placed the Stop Loss above the Evening Star.
However, the setup did not continue immediately in the expected direction.
Price moved back upward and hit my Stop Loss.
The first Sell attempt was therefore unsuccessful.
First Trade: Sell After Evening Star
The first Sell trade was based on three main observations:
- New Market Structure Shift to the downside
- Fibonacci 0.50 retracement
- Evening Star candle
The Stop Loss was placed above the Evening Star.
However, price invalidated this first execution and hit the Stop Loss.
This was an important observation because the initial bearish confirmation did not automatically mean that the entire market structure had become bearish.
The market was still volatile, and the price had not yet completed the structure I needed for a stronger continuation setup.
Second Trade: Buy From the 1-Minute Demand Zone
After the first Stop Loss, price moved back upward and broke the previous 4,401 high.
Following this breakout, I identified a new Demand Zone on the 1-minute chart.
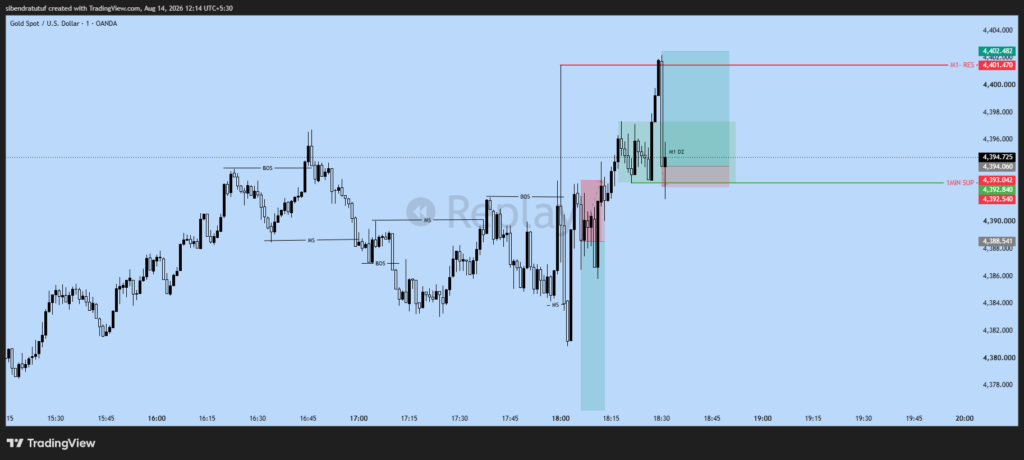
When price returned to this 1-minute Demand Zone, I took a Buy trade.
I placed the Stop Loss below the 1-minute Demand Zone and the nearby Support.
However, this Buy trade also failed.
Price moved through the Demand Zone and hit my Stop Loss.
At this point, both the first Sell and the following Buy had failed.
The important lesson was that the market was still developing its structure. The previous reaction was not enough to establish a reliable directional continuation.
The Market Structure Changed Again
After the second Stop Loss, price returned toward the Fibonacci 0.50 area.
This time, instead of immediately taking another trade based only on the previous reaction, I waited for further price action.
Price rejected the area and formed another Evening Star-type bearish reaction.
I then took a Sell trade with 1% risk.
The Stop Loss was placed around the new high near 4,402, and the planned Take Profit was based on a 1:3 Risk-to-Reward ratio.
This was a different situation from the first Sell.
The reason was that the market had provided additional information after the earlier failed attempts.
Third Trade: Sell From Fibonacci 0.50
The third trade was a Sell after price returned to the Fibonacci 0.50 area.
The confirmation sequence was:
Price retracement → Fibonacci 0.50 → bearish rejection → Sell
I used 1% risk for this trade.
The Stop Loss was placed around the new high near 4,402, while the planned Take Profit was set at a 1:3 Risk-to-Reward ratio.
The important difference was that I was no longer relying on the first Market Structure Shift alone.
I was observing how price behaved after the earlier failed trades.
Fourth Trade: Sell After the Next Bearish Confirmation
After the previous Sell setup, price moved down again and formed another Evening Star candle.
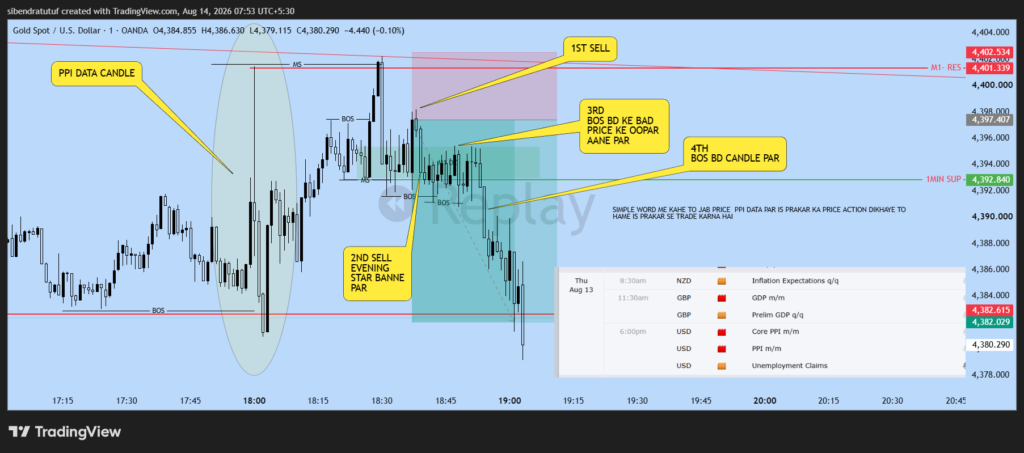
I took another Sell trade with 1% risk.
For this trade, the Stop Loss was placed around the lower high near 4,397, and the planned Take Profit was again based on a 1:3 Risk-to-Reward ratio.
The price action was becoming more structured.
Instead of randomly entering during the volatility, I was using the same basic confirmation process:
Bearish price action → Structure confirmation → Retracement → Sell
Fifth Trade: Sell After BOS Breakdown and Fibonacci Retracement
The next important development was a Break of Structure to the downside.
After the BOS breakdown, price retraced back toward the Fibonacci 0.50 level.
This created another Sell opportunity.
I again used 1% risk.
The Stop Loss was placed around the lower high near 4,397, with a planned 1:3 Risk-to-Reward ratio.
The setup was based on a more complete sequence:
BOS Breakdown → Fibonacci 0.50 Retracement → Bearish Confirmation → Sell
This was the clearest structure in the sequence because the market had already demonstrated bearish continuation after the BOS.
Trade Management and Result
After the later Sell setups, price continued lower and eventually reached the 4,381 area.
This downward move produced a good profit opportunity from the later Sell positions.
However, the overall sequence also included two earlier Stop Losses:
- First Sell — Stop Loss hit.
- Second Buy — Stop Loss hit.
- Later Sell — 1% risk.
- Later Sell — 1% risk.
- Later Sell after BOS and Fibonacci retracement — 1% risk.
I am not assigning a total percentage profit or loss to the sequence because the exact realized P&L for each position was not provided.
The key point is that the profitable move came after additional market structure confirmation rather than from the first reaction.
What Went Wrong in the First Two Trades?
The first Sell had a logical confirmation: Market Structure Shift, Fibonacci 0.50 retracement, and Evening Star.
Yet the trade failed.
The second Buy also had a logical reason because price had broken the previous high and created a 1-minute Demand Zone.
That trade failed as well.
The important observation is that both trades were taken during a period when price was still producing rapid structural changes.
The market had not yet established the clean continuation that appeared later.
Therefore, the main issue was not simply that the individual setups were technically wrong. The larger problem was that the market was still developing its next directional move.
Trading Psychology
The biggest psychological challenge in this sequence was dealing with multiple failed attempts during a highly volatile session.
After one Stop Loss, it is easy to become attached to the original directional idea.
After two Stop Losses, the temptation can become even stronger to immediately recover the loss.
This experience also reminded me of my previous XAUUSD case study, Why I Lost Two Buy Trades at Daily High, where I reviewed the mistakes behind repeated Buy entries near the Daily High.
In this case, the better approach was to continue observing the structure rather than forcing the next trade.
The later Sell setups came only after additional confirmation.
That difference is important.
I was not trying to predict that price must fall. I was reacting to the new information created by the market.
New Trading Rule / Improved Execution Rule
This trade reinforced an important execution rule for my 1-minute trading:
Do not treat every reaction as a complete setup.
A Market Structure Shift or a single candle pattern can provide an initial indication, but the quality of the setup improves when the subsequent price action confirms the direction.
My improved execution framework is:
Structure → Retracement → Confirmation → Entry
Rather than:
Level → Candle → Immediate Entry
This distinction is especially important during high-volatility sessions such as major U.S. economic data releases.
Risk Management
Risk management was important throughout this sequence.
The later Sell trades were taken with 1% risk per trade, and the planned Risk-to-Reward ratio was 1:3.
For the first two trades, exact risk percentages were not provided, so I will not assign a number to them.
The Stop Loss locations were based on the structure of each individual setup:
- First Sell: above the Evening Star.
- Second Buy: below the 1-minute Demand Zone and Support.
- Later Sell: around the new high near 4,402.
- Subsequent Sell: around the lower high near 4,397.
- Final Sell: around the lower high near 4,397.
This shows why Stop Loss placement should be connected to setup invalidation rather than an arbitrary distance.
Smart Money Concepts Analysis
The main concepts visible in this case study were:
- Higher Timeframe Analysis
- Market Structure
- Market Structure Shift
- Break of Structure
- Demand Zone
- Support
- Resistance
- Fibonacci 0.50
- Evening Star confirmation
- Setup Invalidation
- Lower-Timeframe Execution
The most important concept was the relationship between Market Structure and retracement.
The Fibonacci 0.50 level was not used alone.
The better setups appeared when the retracement occurred after a structural move and was followed by bearish price action.
This is an important distinction. A Fibonacci level by itself does not create a trade. It becomes more useful when it aligns with the price-action sequence being observed.
Lessons Learned
1. A Market Structure Shift is not always enough
The first bearish Market Structure Shift produced a Sell opportunity, but the trade still failed.
The lesson is that I need to evaluate what happens after the initial shift rather than assuming immediate continuation.
2. A Demand Zone can also fail
The second trade was based on a 1-minute Demand Zone after the breakout of the previous high.
Price still moved through the zone and hit the Stop Loss.
Therefore, a Demand Zone should be treated as an area of interest, not as a guaranteed reversal point.
3. Fibonacci 0.50 works better with price-action confirmation
The later Sell setups became stronger when the Fibonacci 0.50 retracement was combined with bearish price action and Market Structure confirmation.
4. Do not force a trade after a Stop Loss
The first two trades failed.
Instead of immediately increasing risk or forcing another entry, the market needed to provide new information.
5. BOS can provide stronger continuation information
The later BOS breakdown gave a clearer indication that bearish continuation was developing.
The following Fibonacci retracement then provided another opportunity to participate in the move.
6. Each entry must have its own invalidation
The Stop Loss locations were connected to the structure of each individual setup.
This keeps the trade idea and risk management connected.
7. High-volatility sessions require patience
The PPI session produced several rapid changes in price action.
The biggest lesson was not to react to every candle. I need to wait for the sequence to develop.
Conclusion
This XAUUSD PPI-session trade was not a simple one-directional setup.
The market first created a bearish Market Structure Shift, then invalidated the first Sell. It subsequently broke the previous high and invalidated the following Buy from the 1-minute Demand Zone.
Only after additional bearish structure developed did the later Sell setups become clearer.
The most important lesson for me was that a trade confirmation is a process, not a single candle or level.
The sequence became more reliable when Market Structure, Fibonacci 0.50 retracement, and bearish price action appeared together.
Ultimately, the goal is not to predict every move. My goal is to identify the market structure, wait for confirmation, define invalidation, manage risk, and execute only when the complete setup is present.
TradeLogics lesson: Teach the logic behind the trade, not just the trade itself.
FAQ
Why did the first Sell trade fail?
The first Sell was based on a Market Structure Shift, Fibonacci 0.50 retracement, and Evening Star. However, price moved back upward and hit the Stop Loss. The initial bearish reaction did not lead immediately to the expected continuation.
Why did the second Buy trade fail?
After price broke the previous 4,401 high, I identified a 1-minute Demand Zone and entered a Buy when price returned to it. Price subsequently moved through the Demand Zone and hit the Stop Loss.
Why were the later Sell setups different?
The later Sell setups were supported by additional bearish price action and, eventually, a BOS breakdown followed by a Fibonacci 0.50 retracement.
Why was the Stop Loss placed near 4,397 on the later Sell trades?
The Stop Loss was placed around the lower high near 4,397, according to the structure of those individual 1-minute setups.
What was the main lesson from this trade?
The main lesson was to avoid treating one candle, one level, or one Market Structure Shift as a complete setup. The better approach is to wait for the full sequence of structure, retracement, confirmation, and entry.