
BTCUSDT Trade Case Study: Daily Resistance Breakout with H1 Order Block Confirmation
Last Updated:
31 July 2026
This case study demonstrates how a Daily Resistance Breakout, combined with H1 Smart Money Concepts (SMC) confirmation, provided a disciplined BTCUSDT Buy opportunity.
The article covers the complete market analysis, execution process, risk management, and key trading lessons.
| Market: | Cryptocurrency |
| Instrument: | BTCUSDT Perpetual |
| Strategy: | Smart Money Concepts (SMC) |
| Timeframe: | Daily + H1 |
| Trade Date: | 21 July 2026 |
| Trade Result: | TP Hit |
Introduction
Every successful trade begins with a well-defined plan, not with an impulse.
Therefore, I waited for multiple confirmations before entering the trade.
As a result, the setup aligned with both the Daily and H1 market structure.
In this BTCUSDT trade, I combined a Daily Resistance Breakout with Smart Money Concepts (SMC) confirmation on the H1 timeframe.
Instead of chasing the breakout, I waited for price to retrace into a high-probability area where multiple technical factors aligned.
This case study explains the complete thought process behind the trade—from higher timeframe analysis to execution, risk management, and the lessons learned.
Therefore, this case study focuses not only on the successful outcome but also on the decision-making process behind the trade.
Understanding why each confirmation mattered is more valuable than simply knowing the final result.
Trade Summary
| Item | Details |
|---|---|
| Instrument | BTCUSDT Perpetual |
| Trade Type | Buy |
| Higher Timeframe | Daily |
| Entry Timeframe | H1 |
| Strategy | Smart Money Concepts |
| Entry Price | 65,939 |
| Stop Loss | 65,596 |
| Take Profit | 66,398 |
| Trade Result | TP Hit |
Overall, the higher timeframe remained the primary guide.
However, the final entry was executed only after the H1 confirmation validated the setup.
Table of Contents
- Market Context
- Daily Timeframe Analysis
- Trading Plan
- H1 Confirmation
- Trade Execution
- Risk Management Breakdown
- SMC Concepts Used
- Why the Trade Worked
- What Could Have Invalidated the Setup?
- Lessons Learned
- Key Takeaways
- Final Thoughts
This case study follows a step-by-step trading process, from market context to trade execution and the final lessons learned.
1. Market Context
Bitcoin had been trading inside a bearish market structure for several weeks.
According to Dow Theory, the market continued to produce Lower Highs (LH) and Lower Lows (LL), indicating that sellers still controlled the higher timeframe.
Although the broader market structure was bearish, buyers successfully defended the higher timeframe support.
Therefore, I remained open to a temporary bullish continuation.
However, on 21 July 2026, something important happened.
The Daily candle successfully closed above the previous Daily Resistance at 65,597.
This breakout suggested that buyers were becoming stronger and that momentum might be shifting, even though the overall Daily market structure had not yet fully changed.
However, a breakout alone was not enough.
I needed confirmation from the lower timeframe before considering any long position. Therefore, the H1 chart became the primary execution timeframe.
Daily Timeframe Analysis
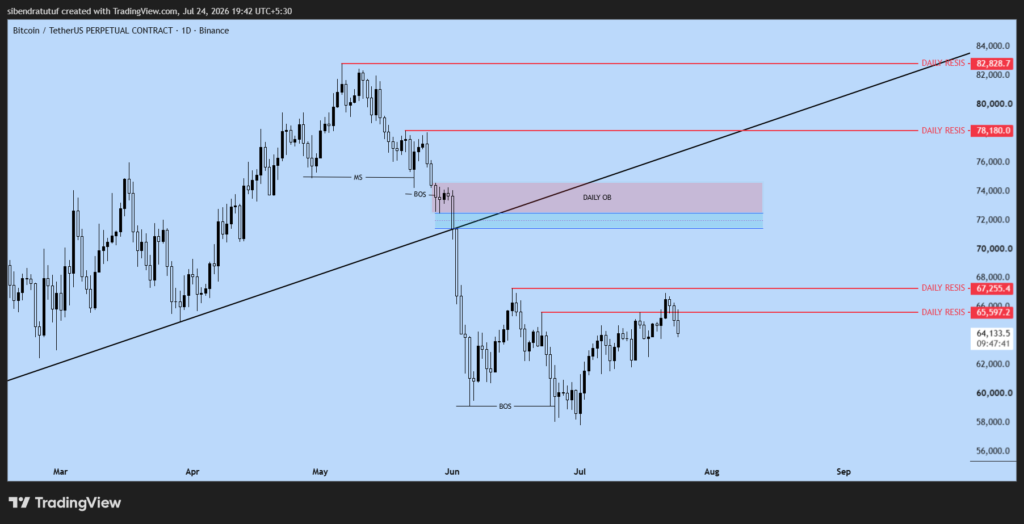
Although the broader market structure remained bearish, the successful breakout provided the higher timeframe bullish bias for the H1 Smart Money Concepts trade setup.
Key Observation
Although the Daily trend remained bearish, the breakout above resistance shifted the short-term market bias in favor of buyers.
Chart Source: All charts in this case study were analyzed using TradingView.
2. Daily Timeframe Analysis
My Daily analysis produced two different observations.
Observation 1 – Market Structure
Using Dow Theory, Bitcoin was still making:
- Lower Highs
- Lower Lows
This meant the primary trend was still bearish.
Consequently, the Daily chart provided the directional bias for the lower timeframe analysis.
Summary
The overall trend remained bearish despite the temporary bullish breakout.
Observation 2 – Resistance Breakout
Despite the bearish structure, price managed to close above the important Daily Resistance level at 65,597.
The next major Daily Resistance was located around 67,255.
This breakout suggested that buyers had enough strength to challenge the existing bearish trend.
Instead of buying immediately, I decided to wait for confirmation on a lower timeframe.
However, a breakout alone was not enough. Confirmation on the H1 chart remained essential.
Summary
The successful breakout increased the probability of a bullish continuation but still required lower timeframe confirmation.
3. Trading Plan
The Daily breakout created a bullish opportunity, but I did not want to enter emotionally.
Before executing the trade, I prepared a rule-based plan.
This reduced emotional decisions and ensured that every condition was satisfied before entry.
My plan was simple:
- Wait for H1 confirmation.
- Identify a valid Bullish Order Block.
- Look for a Fair Value Gap (FVG).
- Use Fibonacci Discount Zone for a better entry.
- Place a Buy Limit instead of entering at market price.
This approach helped me avoid FOMO and maintain discipline.
Execution Rule
No trade would be taken unless all five conditions were satisfied simultaneously.
4. H1 Confirmation
When I switched to the H1 chart, multiple Smart Money Concepts aligned.
I identified:
- Bullish Order Block
- Bullish Fair Value Gap
- Bullish Break of Structure (BOS)
- Fibonacci Discount Zone
Instead of chasing the rally, I waited for price to retrace into the Order Block and Discount Zone.
This gave me a high-probability entry with a clearly defined stop loss.
Key Decision
The Buy Limit order was placed only after every confirmation aligned with the Daily bias.
Trade Execution (H1)
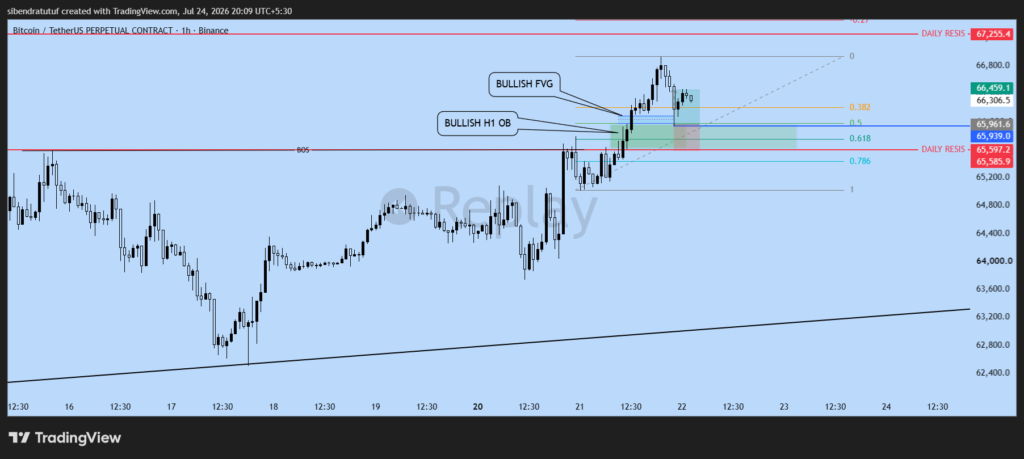
Meanwhile, the H1 structure shifted in favor of buyers.
As a result, the entry conditions became significantly stronger.
Finally, the position was executed only after all predefined rules were satisfied.
5. Trade Execution
After confirmation, I placed the following trade.
| Parameter | Value |
|---|---|
| Entry | 65,939 |
| Stop Loss | 65,596 |
| Take Profit | 66,398 |
The trade respected the Bullish Order Block, reacted from the Fair Value Gap, and continued upward until the Take Profit target was reached.
The setup played out exactly as planned.
6. Risk Management Breakdown
Good analysis is meaningless without proper risk management.
For this trade:
| Metric | Details |
|---|---|
| Entry Method | Buy Limit |
| Stop Loss | Below Bullish Order Block |
| Target | Next Liquidity Area |
| Risk Planning | Fixed before entry |
| Emotional Trading | None |
Rather than reacting to every candle, I trusted the predefined trading plan.
This reduced emotional decision-making and improved execution quality.
Moreover, the position size remained fixed throughout the trade.
Therefore, the predefined risk parameters were never violated.
Risk Principle
Capital protection remained the first priority throughout the trade.
7. Smart Money Concepts Used
Several SMC concepts worked together in this setup.
| Concept | Purpose |
|---|---|
| Daily Resistance | Higher timeframe breakout |
| Bullish BOS | Market confirmation |
| Order Block | Entry zone |
| Fair Value Gap | Confluence |
| Fibonacci Discount Zone | Better pricing |
| Liquidity Target | Profit objective |
| Market Structure | Overall directional bias |
No single concept generated the trade.
The strength of this setup came from the confluence of multiple factors.
Each Smart Money Concept complemented the others.
Instead of relying on a single signal, the trade was based on multiple confirmations.
Important Note
No single Smart Money Concept generated this trade. The edge came from combining multiple confirmations into one structured decision.
8. Why This Trade Worked
This setup worked because several independent confirmations aligned at the same location. As a result, the probability of success increased significantly before execution.
- Daily Resistance was successfully broken.
- H1 confirmed bullish momentum.
- Price retraced into a high-quality Bullish Order Block.
- Fair Value Gap added confluence.
- Fibonacci Discount Zone improved entry quality.
- Risk was predefined before execution.
Finally trade followed a structured process rather than relying on prediction.
9. What Could Have Invalidated This Setup?
Every trading setup must have a clear invalidation point.
This trade would have become invalid if:
- Price had closed back below the Daily Resistance.
- H1 had printed a bearish Break of Structure.
- The Bullish Order Block had failed.
- Strong bearish momentum had invalidated the bullish bias.
Having an invalidation plan is just as important as having an entry plan.
Therefore, I remained prepared to cancel the trade immediately if any invalidation condition appeared.
Professional traders prepare for invalidation before they prepare for profit.
10. Lessons Learned
This trade reinforced several important trading principles.
Therefore, I remained prepared to cancel the trade immediately if any invalidation condition appeared.
- Never chase a breakout.
- Wait for a pullback into a high-probability zone.
- Combine higher timeframe bias with lower timeframe confirmation.
- Use multiple SMC confluences instead of relying on one signal.
- Define risk before entering a trade.
- Execute the plan with discipline.
Overall, this trade reinforced that patience and confirmation consistently outperform emotional decision-making.
11. Key Takeaways
TradeLogics Key Takeaways
- A Daily Resistance Breakout can create high-quality opportunities, even within a broader bearish structure.
- Lower timeframe confirmation increases the probability of success.
- Order Blocks and Fair Value Gaps are more effective when supported by market structure.
- Fibonacci Discount Zones can improve entry precision.
- Risk management should always be planned before execution.
- Discipline and patience are often more valuable than predicting market direction.
- Overall, patience, confirmation, and disciplined risk management were the primary reasons behind the successful outcome.
Final Thoughts
This trade was not about predicting where Bitcoin would go next.
It was about waiting for the market to provide confirmation and then executing a predefined plan with discipline.
Although the broader Daily market structure remained bearish, the breakout above a significant resistance level combined with H1 Smart Money Concepts created a high-probability buying opportunity.
Consistently following this process is far more important than focusing on the outcome of any single trade.
Ultimately, successful trading is not about predicting the market.
Instead, it is about executing a proven process with patience and discipline.
Ultimately, successful trading is not about predicting future price movements.
It is about consistently executing a proven process with discipline, patience, and effective risk management.
Over time, this consistency creates long-term trading performance.
Continue learning by exploring the following related trading guides and case studies.
Related Articles
- Smart Money Concepts (SMC)
- Order Block Trading Guide
- Fair Value Gap (FVG) Explained
- Fibonacci Retracement Strategy
- BTCUSDT Market Analysis
About the Author
Sibendra
Professional Trader
Founder of TradeLogics
Specializes in BTCUSDT, Gold, Smart Money Concepts, and multi-timeframe analysis.
Trade Confidence Score
| Metric | Score |
|---|---|
| Higher Timeframe Bias | ⭐⭐⭐⭐☆ |
| Confirmation Quality | ⭐⭐⭐⭐⭐ |
| Risk Management | ⭐⭐⭐⭐⭐ |
| Entry Precision | ⭐⭐⭐⭐⭐ |
| Overall Setup | A+ |
Newsletter CTA
Enjoyed this case study?
Join the TradeLogics Newsletter to receive weekly market analysis, Smart Money Concepts lessons, real trade breakdowns, and practical trading insights delivered directly to your inbox.
No spam.
Only practical trading education.